Nokia 2011 Annual Report Download - page 264
Download and view the complete annual report
Please find page 264 of the 2011 Nokia annual report below. You can navigate through the pages in the report by either clicking on the pages listed below, or by using the keyword search tool below to find specific information within the annual report.-
 1
1 -
2
-
3
-
4
-
5
-
6
-
7
-
8
-
9
-
10
-
11
-
12
-
13
-
14
-
15
-
16
-
17
-
18
-
19
-
20
-
21
-
22
-
23
-
24
-
25
-
26
-
27
-
28
-
29
-
30
-
31
-
32
-
33
-
34
-
35
-
36
-
37
-
38
-
39
-
40
-
41
-
42
-
43
-
44
-
45
-
46
-
47
-
48
-
49
-
50
-
51
-
52
-
53
-
54
-
55
-
56
-
57
-
58
-
59
-
60
-
61
-
62
-
63
-
64
-
65
-
66
-
67
-
68
-
69
-
70
-
71
-
72
-
73
-
74
-
75
-
76
-
77
-
78
-
79
-
80
-
81
-
82
-
83
-
84
-
85
-
86
-
87
-
88
-
89
-
90
-
91
-
92
-
93
-
94
-
95
-
96
-
97
-
98
-
99
-
100
-
101
-
102
-
103
-
104
-
105
-
106
-
107
-
108
-
109
-
110
-
111
-
112
-
113
-
114
-
115
-
116
-
117
-
118
-
119
-
120
-
121
-
122
-
123
-
124
-
125
-
126
-
127
-
128
-
129
-
130
-
131
-
132
-
133
-
134
-
135
-
136
-
137
-
138
-
139
-
140
-
141
-
142
-
143
-
144
-
145
-
146
-
147
-
148
-
149
-
150
-
151
-
152
-
153
-
154
-
155
-
156
-
157
-
158
-
159
-
160
-
161
-
162
-
163
-
164
-
165
-
166
-
167
-
168
-
169
-
170
-
171
-
172
-
173
-
174
-
175
-
176
-
177
-
178
-
179
-
180
-
181
-
182
-
183
-
184
-
185
-
186
-
187
-
188
-
189
-
190
-
191
-
192
-
193
-
194
-
195
-
196
-
197
-
198
-
199
-
200
-
201
-
202
-
203
-
204
-
205
-
206
-
207
-
208
-
209
-
210
-
211
-
212
-
213
-
214
-
215
-
216
-
217
-
218
-
219
-
220
-
221
-
222
-
223
-
224
-
225
-
226
-
227
-
228
-
229
-
230
-
231
-
232
-
233
-
234
-
235
-
236
-
237
-
238
-
239
-
240
-
241
-
242
-
243
-
244
-
245
-
246
-
247
-
248
-
249
-
250
-
251
-
252
-
253
-
 254
254 -
 255
255 -
 256
256 -
 257
257 -
 258
258 -
 259
259 -
 260
260 -
 261
261 -
 262
262 -
 263
263 -
 264
264 -
 265
265 -
 266
266 -
 267
267 -
 268
268 -
 269
269 -
 270
270 -
 271
271 -
 272
272 -
 273
273 -
 274
274 -
275
-
276
-
277
-
278
-
279
-
280
-
281
-
282
-
283
-
284
-
285
-
286
-
287
-
288
-
289
-
290
-
291
-
292
-
293
-
294
-
295
-
296
 |
 |

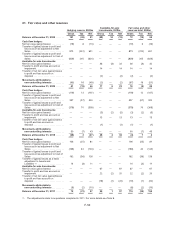
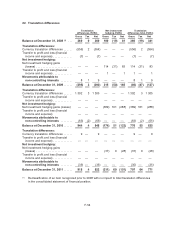
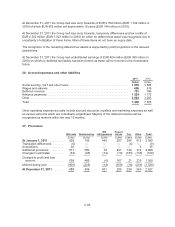
22. Translation differences
Translation
differences, EURm
Net investment
hedging, EURm
Translation
differences total, EURm
Gross Tax Net Gross Tax Net Gross Tax Net
Balance at December 31, 2008 (1) ... 260 0 260 100 (19) 81 360 (19) 341
Translation differences:
Currency translation differences ...... (556) 2 (554) — — — (556) 2 (554)
Transfer to profit and loss (financial
income and expense) ............. (7) — (7) — — — (7) — (7)
Net investment hedging:
Net investment hedging gains
(losses) ........................ — — — 114 (31) 83 114 (31) 83
Transfer to profit and loss (financial
income and expense) ............. — — — 1 — 1 1 — 1
Movements attributable to
non-controlling interests ........ 8 1 9 — — — 8 1 9
Balance at December 31, 2009 ...... (295) 3 (292) 215 (50) 165 (80) (47) (127)
Translation differences:
Currency translation differences ...... 1302 3 1305 — — — 1302 3 1305
Transfer to profit and loss (financial
income and expense) ............. — — — — — — — — —
Net investment hedging:
Net investment hedging gains (losses) — — — (389) 101 (288) (389) 101 (288)
Transfer to profit and loss (financial
income and expense) — — — — — — — — —
Movements attributable to
non-controlling interests ........ (63) (2) (65) — — — (63) (2) (65)
Balance at December 31, 2010 ...... 944 4 948 (174) 51 (123) 770 55 825
Translation differences:
Currency translation differences ...... 9 — 9 — — — 9 — 9
Transfer to profit and loss (financial
income and expense) ............. — — — — — — — — —
Net investment hedging:
Net investment hedging gains
(losses) ........................ — — — (37) 9 (28) (37) 9 (28)
Transfer to profit and loss (financial
income and expense) ............. — — — — — — — — —
Movements attributable to
non-controlling interests ........ (35) — (35) — — — (35) — (35)
Balance at December 31, 2011 ...... 918 4 922 (211) 60 (151) 707 64 771
(1) Reclassification of an item recognized prior to 2008 with no impact to total translation differences
in the consolidated statement of financial position.
F-54