Nokia 2011 Annual Report Download - page 124
Download and view the complete annual report
Please find page 124 of the 2011 Nokia annual report below. You can navigate through the pages in the report by either clicking on the pages listed below, or by using the keyword search tool below to find specific information within the annual report.-
 1
1 -
2
-
3
-
4
-
5
-
6
-
7
-
8
-
9
-
10
-
11
-
12
-
13
-
14
-
15
-
16
-
17
-
18
-
19
-
20
-
21
-
22
-
23
-
24
-
25
-
26
-
27
-
28
-
29
-
30
-
31
-
32
-
33
-
34
-
35
-
36
-
37
-
38
-
39
-
40
-
41
-
42
-
43
-
44
-
45
-
46
-
47
-
48
-
49
-
50
-
51
-
52
-
53
-
54
-
55
-
56
-
57
-
58
-
59
-
60
-
61
-
62
-
63
-
64
-
65
-
66
-
67
-
68
-
69
-
70
-
71
-
72
-
73
-
74
-
75
-
76
-
77
-
78
-
79
-
80
-
81
-
82
-
83
-
84
-
85
-
86
-
87
-
88
-
89
-
90
-
91
-
92
-
93
-
94
-
95
-
96
-
97
-
98
-
99
-
100
-
101
-
102
-
103
-
104
-
105
-
106
-
107
-
108
-
109
-
110
-
111
-
112
-
113
-
 114
114 -
 115
115 -
 116
116 -
 117
117 -
 118
118 -
 119
119 -
 120
120 -
 121
121 -
 122
122 -
 123
123 -
 124
124 -
 125
125 -
 126
126 -
 127
127 -
 128
128 -
 129
129 -
 130
130 -
 131
131 -
 132
132 -
 133
133 -
 134
134 -
135
-
136
-
137
-
138
-
139
-
140
-
141
-
142
-
143
-
144
-
145
-
146
-
147
-
148
-
149
-
150
-
151
-
152
-
153
-
154
-
155
-
156
-
157
-
158
-
159
-
160
-
161
-
162
-
163
-
164
-
165
-
166
-
167
-
168
-
169
-
170
-
171
-
172
-
173
-
174
-
175
-
176
-
177
-
178
-
179
-
180
-
181
-
182
-
183
-
184
-
185
-
186
-
187
-
188
-
189
-
190
-
191
-
192
-
193
-
194
-
195
-
196
-
197
-
198
-
199
-
200
-
201
-
202
-
203
-
204
-
205
-
206
-
207
-
208
-
209
-
210
-
211
-
212
-
213
-
214
-
215
-
216
-
217
-
218
-
219
-
220
-
221
-
222
-
223
-
224
-
225
-
226
-
227
-
228
-
229
-
230
-
231
-
232
-
233
-
234
-
235
-
236
-
237
-
238
-
239
-
240
-
241
-
242
-
243
-
244
-
245
-
246
-
247
-
248
-
249
-
250
-
251
-
252
-
253
-
254
-
255
-
256
-
257
-
258
-
259
-
260
-
261
-
262
-
263
-
264
-
265
-
266
-
267
-
268
-
269
-
270
-
271
-
272
-
273
-
274
-
275
-
276
-
277
-
278
-
279
-
280
-
281
-
282
-
283
-
284
-
285
-
286
-
287
-
288
-
289
-
290
-
291
-
292
-
293
-
294
-
295
-
296
 |
 |

Volume
Mobile Phones volume decreased 3% to 339.8 million units in 2011, compared to 349.2 million units in
2010. The year-on-year decline in our Mobile Phones volumes in 2011 was driven by the challenging
competitive environment, especially during the first half of the year due to our lack of dual SIM phones,
which continued to be a growing part of the market, and pressure from a variety of price aggressive
competitors, which adversely affected our Mobile Phones volumes. During 2011, Mobile Phones
volumes were also negatively affected by our reduced portfolio of higher priced feature phones, as well
as by distributors and operators purchasing fewer of our feature phones during the second quarter of
2011 as they reduced their inventories of those devices which were slightly above normal levels at the
end of the first quarter of 2011.
During the second half of 2011, our Mobile Phones volumes increased year-on-year, driven by the
introduction and broader availability of our first dual SIM devices and the ongoing product renewal
across the feature phones portfolio, which more than offset our reduced portfolio of higher priced
feature phones.
Average Selling Price
Mobile Phones ASP decreased 10% to EUR 35 in 2011, compared to EUR 39 in 2010. The
year-on-year decline in our Mobile Phones ASP in 2011 was primarily due to a higher proportion of
sales of lower priced devices driven by a reduced portfolio of higher priced feature phones and our
tactical pricing actions across the portfolio, which partially affected the second quarter of 2011 and fully
affected the third quarter of 2011. In addition, the appreciation of the euro against certain currencies
contributed to the decline, which was partially offset by the positive impact from foreign currency
hedging.
Gross Margin
Mobile Phones gross margin was 26.1% in 2011, down from 28.0% in 2010. The year-on-year decline
in our Mobile Phones gross margin in 2011 was due primarily to greater price erosion than cost erosion
due to the competitive environment and our tactical pricing actions across the portfolio which partially
affected the second quarter of 2011 and fully affected the third quarter of 2011, a negative impact from
foreign currency hedging and the appreciation of the euro against certain currencies, which were
partially offset by a product mix shift towards higher margin feature phones.
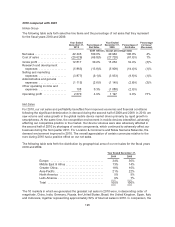
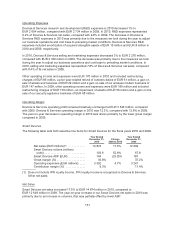
Location & Commerce
The following table sets forth selective line items and the percentage of net sales that they represent
for Location & Commerce for the fiscal years 2011 and 2010.
Year Ended
December 31,
2011
Percentage of
Net Sales
Year Ended
December 31,
2010
Percentage of
Net Sales
Percentage
Increase/
(Decrease)
(EUR millions, except percentage data)
Net sales ........................ 1091 100.0% 869 100.0% 26%
Cost of sales ..................... (214) (19.6)% (169) (19.4)% 27%
Gross profit ...................... 877 80.4% 700 80.6% 25%
Research and development
expenses ...................... (958) (87.8)% (1 011) (116.3)% (5)%
Selling and marketing expenses ..... (259) (23.7)% (274) (31.5)% (5)%
Administrative and general
expenses ...................... (68) (6.2)% (75) (8.6)% (9)%
Other operating income and
expenses ...................... (1118) (102.5)% (3) (0.3)%
Operating profit ................... (1526) (139.9)% (663) (76.3)% (130)%
122