Nokia 2011 Annual Report Download - page 11
Download and view the complete annual report
Please find page 11 of the 2011 Nokia annual report below. You can navigate through the pages in the report by either clicking on the pages listed below, or by using the keyword search tool below to find specific information within the annual report.-
 1
1 -
 2
2 -
 3
3 -
 4
4 -
 5
5 -
 6
6 -
 7
7 -
 8
8 -
 9
9 -
 10
10 -
 11
11 -
 12
12 -
 13
13 -
 14
14 -
 15
15 -
 16
16 -
 17
17 -
 18
18 -
 19
19 -
 20
20 -
 21
21 -
 22
22 -
23
-
24
-
25
-
26
-
27
-
28
-
29
-
30
-
31
-
32
-
33
-
34
-
35
-
36
-
37
-
38
-
39
-
40
-
41
-
42
-
43
-
44
-
45
-
46
-
47
-
48
-
49
-
50
-
51
-
52
-
53
-
54
-
55
-
56
-
57
-
58
-
59
-
60
-
61
-
62
-
63
-
64
-
65
-
66
-
67
-
68
-
69
-
70
-
71
-
72
-
73
-
74
-
75
-
76
-
77
-
78
-
79
-
80
-
81
-
82
-
83
-
84
-
85
-
86
-
87
-
88
-
89
-
90
-
91
-
92
-
93
-
94
-
95
-
96
-
97
-
98
-
99
-
100
-
101
-
102
-
103
-
104
-
105
-
106
-
107
-
108
-
109
-
110
-
111
-
112
-
113
-
114
-
115
-
116
-
117
-
118
-
119
-
120
-
121
-
122
-
123
-
124
-
125
-
126
-
127
-
128
-
129
-
130
-
131
-
132
-
133
-
134
-
135
-
136
-
137
-
138
-
139
-
140
-
141
-
142
-
143
-
144
-
145
-
146
-
147
-
148
-
149
-
150
-
151
-
152
-
153
-
154
-
155
-
156
-
157
-
158
-
159
-
160
-
161
-
162
-
163
-
164
-
165
-
166
-
167
-
168
-
169
-
170
-
171
-
172
-
173
-
174
-
175
-
176
-
177
-
178
-
179
-
180
-
181
-
182
-
183
-
184
-
185
-
186
-
187
-
188
-
189
-
190
-
191
-
192
-
193
-
194
-
195
-
196
-
197
-
198
-
199
-
200
-
201
-
202
-
203
-
204
-
205
-
206
-
207
-
208
-
209
-
210
-
211
-
212
-
213
-
214
-
215
-
216
-
217
-
218
-
219
-
220
-
221
-
222
-
223
-
224
-
225
-
226
-
227
-
228
-
229
-
230
-
231
-
232
-
233
-
234
-
235
-
236
-
237
-
238
-
239
-
240
-
241
-
242
-
243
-
244
-
245
-
246
-
247
-
248
-
249
-
250
-
251
-
252
-
253
-
254
-
255
-
256
-
257
-
258
-
259
-
260
-
261
-
262
-
263
-
264
-
265
-
266
-
267
-
268
-
269
-
270
-
271
-
272
-
273
-
274
-
275
-
276
-
277
-
278
-
279
-
280
-
281
-
282
-
283
-
284
-
285
-
286
-
287
-
288
-
289
-
290
-
291
-
292
-
293
-
294
-
295
-
296
 |
 |

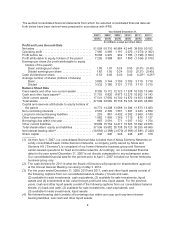
The audited consolidated financial statements from which the selected consolidated financial data set
forth below have been derived were prepared in accordance with IFRS.
Year Ended December 31,
2007(1) 2008(1) 2009(1) 2010(1) 2011(1) 2011(1)
(EUR) (EUR) (EUR) (EUR) (EUR) (USD)
(in millions, except per share data)
Profit and Loss Account Data
Net sales ..................................... 51058 50710 40984 42446 38659 50152
Operating profit ................................ 7985 4966 1197 2070 (1073) (1 392)
Profit before tax ................................ 8268 4970 962 1786 (1198) (1 554)
Profit attributable to equity holders of the parent ..... 7205 3988 891 1850 (1164) (1 510)
Earnings per share (for profit attributable to equity
holders of the parent)
Basic earnings per share .................... 1.85 1.07 0.24 0.50 (0.31) (0.40)
Diluted earnings per share ................... 1.83 1.05 0.24 0.50 (0.31) (0.40)
Cash dividends per share ........................ 0.53 0.40 0.40 0.40 0.20(2) 0.26(2)
Average number of shares (millions of shares)
Basic ..................................... 3885 3744 3705 3709 3710 3710
Diluted ................................... 3932 3780 3721 3713 3710 3710
Balance Sheet Data
Fixed assets and other non-current assets .......... 8305 15112 12125 11978 10750 13946
Cash and other liquid assets(3) .................... 11753 6820 8873 12275 10902 14143
Other current assets ............................ 17541 17650 14740 14870 14553 18880
Total assets ................................... 37599 39582 35738 39123 36205 46969
Capital and reserves attributable to equity holders of
the parent ................................... 14773 14208 13088 14384 11873 15403
Non-controlling interests ......................... 2565 2302 1661 1847 2043 2650
Long-term interest-bearing liabilities ............... 203 861 4432 4242 3969 5149
Other long-term liabilities ........................ 1082 1856 1369 1110 876 1137
Borrowings due within one year ................... 887 3591 771 1037 1352 1754
Other current liabilities .......................... 18089 16764 14417 16503 16092 20876
Total shareholders’ equity and liabilities ............ 37599 39582 35738 39123 36205 46969
Net interest-bearing debt(4) ....................... (10663) (2 368) (3 670) (6 996) (5 581) (7 240)
Share capital .................................. 246 246 246 246 246 319
(1) As from April 1, 2007, our consolidated financial data includes that of Nokia Siemens Networks on
a fully consolidated basis. Nokia Siemens Networks, a company jointly owned by Nokia and
Siemens AG (“Siemens”), is comprised of our former Networks business group and Siemens’
carrier-related operations for fixed and mobile networks. Accordingly, our consolidated financial
data for the year ended December 31, 2007 is not directly comparable to any subsequent years.
Our consolidated financial data for the periods prior to April 1, 2007 included our former Networks
business group only.
(2) The cash dividend for 2011 is what the Board of Directors will propose for shareholders’ approval
at the Annual General Meeting convening on May 3, 2012.
(3) For the years ended December 31, 2009, 2010 and 2011, cash and other liquid assets consist of
the following captions from our consolidated balance sheets: (1) bank and cash,
(2) available-for-sale investments, cash equivalents, (3) available-for-sale investments, liquid
assets and (4) investments at fair value through profit and loss, liquid assets. For the previous
years, cash and other liquid assets consist of the following captions from our consolidated balance
sheets: (1) bank and cash, (2) available-for-sale investments, cash equivalents, and
(3) available-for-sale investments, liquid assets.
(4) Net interest-bearing debt consists of borrowings due within one year and long-term interest-
bearing liabilities, less cash and other liquid assets.
9