Nokia 2011 Annual Report Download - page 287
Download and view the complete annual report
Please find page 287 of the 2011 Nokia annual report below. You can navigate through the pages in the report by either clicking on the pages listed below, or by using the keyword search tool below to find specific information within the annual report.-
 1
1 -
2
-
3
-
4
-
5
-
6
-
7
-
8
-
9
-
10
-
11
-
12
-
13
-
14
-
15
-
16
-
17
-
18
-
19
-
20
-
21
-
22
-
23
-
24
-
25
-
26
-
27
-
28
-
29
-
30
-
31
-
32
-
33
-
34
-
35
-
36
-
37
-
38
-
39
-
40
-
41
-
42
-
43
-
44
-
45
-
46
-
47
-
48
-
49
-
50
-
51
-
52
-
53
-
54
-
55
-
56
-
57
-
58
-
59
-
60
-
61
-
62
-
63
-
64
-
65
-
66
-
67
-
68
-
69
-
70
-
71
-
72
-
73
-
74
-
75
-
76
-
77
-
78
-
79
-
80
-
81
-
82
-
83
-
84
-
85
-
86
-
87
-
88
-
89
-
90
-
91
-
92
-
93
-
94
-
95
-
96
-
97
-
98
-
99
-
100
-
101
-
102
-
103
-
104
-
105
-
106
-
107
-
108
-
109
-
110
-
111
-
112
-
113
-
114
-
115
-
116
-
117
-
118
-
119
-
120
-
121
-
122
-
123
-
124
-
125
-
126
-
127
-
128
-
129
-
130
-
131
-
132
-
133
-
134
-
135
-
136
-
137
-
138
-
139
-
140
-
141
-
142
-
143
-
144
-
145
-
146
-
147
-
148
-
149
-
150
-
151
-
152
-
153
-
154
-
155
-
156
-
157
-
158
-
159
-
160
-
161
-
162
-
163
-
164
-
165
-
166
-
167
-
168
-
169
-
170
-
171
-
172
-
173
-
174
-
175
-
176
-
177
-
178
-
179
-
180
-
181
-
182
-
183
-
184
-
185
-
186
-
187
-
188
-
189
-
190
-
191
-
192
-
193
-
194
-
195
-
196
-
197
-
198
-
199
-
200
-
201
-
202
-
203
-
204
-
205
-
206
-
207
-
208
-
209
-
210
-
211
-
212
-
213
-
214
-
215
-
216
-
217
-
218
-
219
-
220
-
221
-
222
-
223
-
224
-
225
-
226
-
227
-
228
-
229
-
230
-
231
-
232
-
233
-
234
-
235
-
236
-
237
-
238
-
239
-
240
-
241
-
242
-
243
-
244
-
245
-
246
-
247
-
248
-
249
-
250
-
251
-
252
-
253
-
254
-
255
-
256
-
257
-
258
-
259
-
260
-
261
-
262
-
263
-
264
-
265
-
266
-
267
-
268
-
269
-
270
-
271
-
272
-
273
-
274
-
275
-
276
-
 277
277 -
 278
278 -
 279
279 -
 280
280 -
 281
281 -
 282
282 -
 283
283 -
 284
284 -
 285
285 -
 286
286 -
 287
287 -
 288
288 -
 289
289 -
 290
290 -
 291
291 -
 292
292 -
 293
293 -
 294
294 -
 295
295 -
 296
296
 |
 |

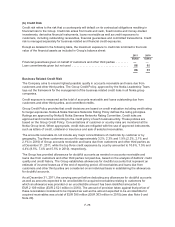
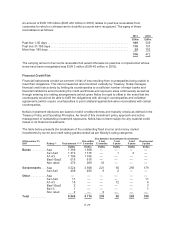
An amount of EUR 316 million (EUR 472 million in 2010) relates to past due receivables from
customers for which no allowances for doubtful accounts were recognized. The aging of these
receivables is as follows:
2011 2010
EURm EURm
Past due 1-30 days ..................................................... 169 239
Past due 31-180 days ................................................... 118 131
More than 180 days .................................................... 29 102
316 472
The carrying amount of accounts receivable that would otherwise be past due or impaired but whose
terms have been renegotiated was EUR 3 million (EUR 40 million in 2010).
Financial Credit Risk
Financial instruments contain an element of risk of loss resulting from counterparties being unable to
meet their obligations. This risk is measured and monitored centrally by Treasury. Nokia manages
financial credit risk actively by limiting its counterparties to a sufficient number of major banks and
financial institutions and monitoring the credit worthiness and exposure sizes continuously as well as
through entering into netting arrangements (which gives Nokia the right to offset in the event that the
counterparty would not be able to fulfill the obligations) with all major counterparties and collateral
agreements (which require counterparties to post collateral against derivative receivables) with certain
counterparties.
Nokia’s investment decisions are based on strict creditworthiness and maturity criteria as defined in the
Treasury Policy and Operating Principles. As result of this investment policy approach and active
management of outstanding investment exposures, Nokia has not been subject to any material credit
losses in its financial investments.
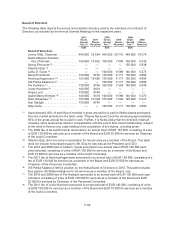
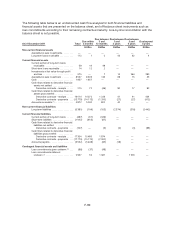
The table below presents the breakdown of the outstanding fixed income and money market
investments by sector and credit rating grades ranked as per Moody’s rating categories.
At December 31,
2011 Rating (3) Total amount (1), (2)
Due within
3 months
Due between
3 and
12 months
Due between
1 and
3 years
Due between
3 and
5 years
Due beyond
5 years
EURm EURm EURm EURm EURm EURm
Banks ......... Aaa 1368 1368 — — — —
Aa1-Aa3 1 319 1 316 — 1 2 —
A1-A3 1 706 1 706 — — — —
Baa1-Baa3 616 616 — — — —
Non rated 270 260 10 — — —
Governments . . . Aaa 3 224 2 508 221 50 266 179
Aa1-Aa3 408 400 6 2 — —
Other .......... Aaa — — — — — —
Aa1-Aa3 11 — — — — 11
A1-A3 18 — — 12 — 6
Baa1-Baa3 2 — — — — 2
Ba1-C 1 — — — — 1
Non rated 2 — 2 — — —
Total .......... 8 945 8 174 239 65 268 199
F-77