Nokia 2011 Annual Report Download - page 245
Download and view the complete annual report
Please find page 245 of the 2011 Nokia annual report below. You can navigate through the pages in the report by either clicking on the pages listed below, or by using the keyword search tool below to find specific information within the annual report.-
 1
1 -
2
-
3
-
4
-
5
-
6
-
7
-
8
-
9
-
10
-
11
-
12
-
13
-
14
-
15
-
16
-
17
-
18
-
19
-
20
-
21
-
22
-
23
-
24
-
25
-
26
-
27
-
28
-
29
-
30
-
31
-
32
-
33
-
34
-
35
-
36
-
37
-
38
-
39
-
40
-
41
-
42
-
43
-
44
-
45
-
46
-
47
-
48
-
49
-
50
-
51
-
52
-
53
-
54
-
55
-
56
-
57
-
58
-
59
-
60
-
61
-
62
-
63
-
64
-
65
-
66
-
67
-
68
-
69
-
70
-
71
-
72
-
73
-
74
-
75
-
76
-
77
-
78
-
79
-
80
-
81
-
82
-
83
-
84
-
85
-
86
-
87
-
88
-
89
-
90
-
91
-
92
-
93
-
94
-
95
-
96
-
97
-
98
-
99
-
100
-
101
-
102
-
103
-
104
-
105
-
106
-
107
-
108
-
109
-
110
-
111
-
112
-
113
-
114
-
115
-
116
-
117
-
118
-
119
-
120
-
121
-
122
-
123
-
124
-
125
-
126
-
127
-
128
-
129
-
130
-
131
-
132
-
133
-
134
-
135
-
136
-
137
-
138
-
139
-
140
-
141
-
142
-
143
-
144
-
145
-
146
-
147
-
148
-
149
-
150
-
151
-
152
-
153
-
154
-
155
-
156
-
157
-
158
-
159
-
160
-
161
-
162
-
163
-
164
-
165
-
166
-
167
-
168
-
169
-
170
-
171
-
172
-
173
-
174
-
175
-
176
-
177
-
178
-
179
-
180
-
181
-
182
-
183
-
184
-
185
-
186
-
187
-
188
-
189
-
190
-
191
-
192
-
193
-
194
-
195
-
196
-
197
-
198
-
199
-
200
-
201
-
202
-
203
-
204
-
205
-
206
-
207
-
208
-
209
-
210
-
211
-
212
-
213
-
214
-
215
-
216
-
217
-
218
-
219
-
220
-
221
-
222
-
223
-
224
-
225
-
226
-
227
-
228
-
229
-
230
-
231
-
232
-
233
-
234
-
 235
235 -
 236
236 -
 237
237 -
 238
238 -
 239
239 -
 240
240 -
 241
241 -
 242
242 -
 243
243 -
 244
244 -
 245
245 -
 246
246 -
 247
247 -
 248
248 -
 249
249 -
 250
250 -
 251
251 -
 252
252 -
 253
253 -
 254
254 -
 255
255 -
256
-
257
-
258
-
259
-
260
-
261
-
262
-
263
-
264
-
265
-
266
-
267
-
268
-
269
-
270
-
271
-
272
-
273
-
274
-
275
-
276
-
277
-
278
-
279
-
280
-
281
-
282
-
283
-
284
-
285
-
286
-
287
-
288
-
289
-
290
-
291
-
292
-
293
-
294
-
295
-
296
 |
 |
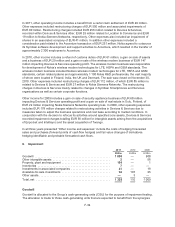
of the business combination in which the goodwill arose. In 2011, the Group has allocated goodwill to
four cash-generating units, which correspond to the Group’s reportable segments: Smart Devices
CGU, Mobile Phones CGU, Location & Commerce CGU and Nokia Siemens Networks CGU. For the
purposes of the Group’s 2011 annual impairment testing, the amount of goodwill previously allocated in
2010 to the Devices & Services CGU has been reallocated to the Smart Devices CGU and the Mobile
Phones CGU based on their relative fair values. Based on the Group’s assessment, no goodwill was
allocated from Devices & Services to Location & Commerce pursuant to the formation of Location &
Commerce business unit and segment on October 1, 2011. The organizational changes were not a
driver of, and did not result in an impairment in the Location & Commerce CGU.
The recoverable amounts for the Smart Devices CGU and the Mobile Phones CGU are based on value
in use calculations. A discounted cash flow calculation was used to estimate the value in use for both
CGUs. Cash flow projections determined by management are based on information available, to reflect
the present value of the future cash flows expected to be derived through the continuing use of the
Smart Devices CGU and the Mobile Phones CGU.
The recoverable amounts for the Location & Commerce CGU and the Nokia Siemens Networks CGU
are based on fair value less costs to sell. A discounted cash flow calculation was used to estimate the
fair value less costs to sell for both CGUs. The cash flow projections employed in the discounted cash
flow calculation have been determined by management based on the information available, to reflect
the amount that an entity could obtain from separate disposal of each of the Location & Commerce
CGU and the Nokia Siemens Networks CGU, in an arm’s length transaction between knowledgeable,
willing parties, after deducting the estimated costs of disposal.
The cash flow projections employed in the value in use and the fair value less costs to sell calculations
are based on detailed financial plans approved by management, covering a three-year planning horizon.
Cash flows in subsequent periods reflect a realistic pattern of slowing growth that declines towards an
estimated terminal growth rate utilized in the terminal period. The terminal growth rate utilized does not
exceed long-term average growth rates for the industry and economies in which the CGU operates. All
cash flow projections are consistent with external sources of information, wherever available.
Goodwill amounting to EUR 862 million, EUR 502 million and EUR 173 million was allocated to the
Smart Devices CGU, Mobile Phones CGU and Nokia Siemens Networks CGU, respectively, at the
date of the 2011 impairment testing. The goodwill impairment testing conducted for the aforementioned
CGUs did not result in any impairment charges for the year ended December 31, 2011.
In the fourth quarter of 2011, the Group conducted annual impairment testing for the Location &
Commerce CGU to assess if events or changes in circumstances indicated that the carrying amount of
the Location & Commerce CGU was not recoverable. As a result, the Group recorded an impairment
loss of EUR 1 090 million to reduce the carrying amount of the Location & Commerce CGU to its
recoverable amount. The impairment loss was allocated in its entirety to the carrying amount of
goodwill in the balance sheet of the Location & Commerce CGU. This impairment loss is presented as
impairment of goodwill in the consolidated income statement. As a result of the impairment loss, the
amount of goodwill allocated to the Location & Commerce CGU has been reduced to EUR 3 274
million at December 31, 2011.
The impairment charge is the result of an evaluation of the projected financial performance and net
cash flows of the Location & Commerce CGU. The main drivers for management’s net cash flow
projections include license fees related to digital map data, fair value of the services sold within the
Group and estimated average revenue per user with regard to mobile media advertising. The average
revenue per user is estimated based on peer market data for mobile advertising revenue. Projected
device sales volumes impact the overall forecasted intercompany and advertising revenues. This takes
F-35