Nokia 2011 Annual Report Download - page 241
Download and view the complete annual report
Please find page 241 of the 2011 Nokia annual report below. You can navigate through the pages in the report by either clicking on the pages listed below, or by using the keyword search tool below to find specific information within the annual report.-
 1
1 -
2
-
3
-
4
-
5
-
6
-
7
-
8
-
9
-
10
-
11
-
12
-
13
-
14
-
15
-
16
-
17
-
18
-
19
-
20
-
21
-
22
-
23
-
24
-
25
-
26
-
27
-
28
-
29
-
30
-
31
-
32
-
33
-
34
-
35
-
36
-
37
-
38
-
39
-
40
-
41
-
42
-
43
-
44
-
45
-
46
-
47
-
48
-
49
-
50
-
51
-
52
-
53
-
54
-
55
-
56
-
57
-
58
-
59
-
60
-
61
-
62
-
63
-
64
-
65
-
66
-
67
-
68
-
69
-
70
-
71
-
72
-
73
-
74
-
75
-
76
-
77
-
78
-
79
-
80
-
81
-
82
-
83
-
84
-
85
-
86
-
87
-
88
-
89
-
90
-
91
-
92
-
93
-
94
-
95
-
96
-
97
-
98
-
99
-
100
-
101
-
102
-
103
-
104
-
105
-
106
-
107
-
108
-
109
-
110
-
111
-
112
-
113
-
114
-
115
-
116
-
117
-
118
-
119
-
120
-
121
-
122
-
123
-
124
-
125
-
126
-
127
-
128
-
129
-
130
-
131
-
132
-
133
-
134
-
135
-
136
-
137
-
138
-
139
-
140
-
141
-
142
-
143
-
144
-
145
-
146
-
147
-
148
-
149
-
150
-
151
-
152
-
153
-
154
-
155
-
156
-
157
-
158
-
159
-
160
-
161
-
162
-
163
-
164
-
165
-
166
-
167
-
168
-
169
-
170
-
171
-
172
-
173
-
174
-
175
-
176
-
177
-
178
-
179
-
180
-
181
-
182
-
183
-
184
-
185
-
186
-
187
-
188
-
189
-
190
-
191
-
192
-
193
-
194
-
195
-
196
-
197
-
198
-
199
-
200
-
201
-
202
-
203
-
204
-
205
-
206
-
207
-
208
-
209
-
210
-
211
-
212
-
213
-
214
-
215
-
216
-
217
-
218
-
219
-
220
-
221
-
222
-
223
-
224
-
225
-
226
-
227
-
228
-
229
-
230
-
 231
231 -
 232
232 -
 233
233 -
 234
234 -
 235
235 -
 236
236 -
 237
237 -
 238
238 -
 239
239 -
 240
240 -
 241
241 -
 242
242 -
 243
243 -
 244
244 -
 245
245 -
 246
246 -
 247
247 -
 248
248 -
 249
249 -
 250
250 -
 251
251 -
252
-
253
-
254
-
255
-
256
-
257
-
258
-
259
-
260
-
261
-
262
-
263
-
264
-
265
-
266
-
267
-
268
-
269
-
270
-
271
-
272
-
273
-
274
-
275
-
276
-
277
-
278
-
279
-
280
-
281
-
282
-
283
-
284
-
285
-
286
-
287
-
288
-
289
-
290
-
291
-
292
-
293
-
294
-
295
-
296
 |
 |

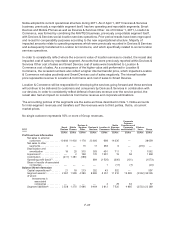
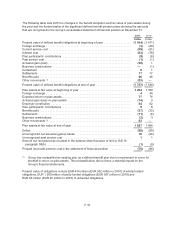
The following table sets forth the changes in the benefit obligation and fair value of plan assets during
the year and the funded status of the significant defined benefit pension plans showing the amounts
that are recognized in the Group’s consolidated statement of financial position at December 31:
2011 2010
EURm EURm
Present value of defined benefit obligations at beginning of year .................. (1 544) (1 411)
Foreign exchange ........................................................ (3) (49)
Current service cost ...................................................... (59) (61)
Interest cost ............................................................. (83) (78)
Plan participants’ contributions .............................................. (9) (8)
Past service cost ......................................................... (1) (1)
Actuarial gain (loss) ....................................................... (26) 1
Business combinations .................................................... —(1)
Curtailment ............................................................. 81
Settlements ............................................................. 17 17
Benefits paid ............................................................ 46 46
Other movements (1) ...................................................... (83) —
Present value of defined benefit obligations at end of year ....................... (1 737) (1 544)
Plan assets at fair value at beginning of year .................................. 1 494 1 330
Foreign exchange ........................................................ 444
Expected return on plan assets ............................................. 77 76
Actuarial gain (loss) on plan assets .......................................... (14) 9
Employer contribution ..................................................... 54 62
Plan participants’ contributions .............................................. 98
Benefits paid ............................................................ (37) (32)
Settlements ............................................................. (11) (6)
Business combinations .................................................... (2) 3
Other movements (1) ...................................................... 83 —
Plan assets at fair value at end of year ....................................... 1 657 1 494
Deficit .................................................................. (80) (50)
Unrecognized net actuarial (gains) losses .................................... 10 (26)
Unrecognized past service cost ............................................. 11
Amount not recognized as an asset in the balance sheet because of limit in IAS 19
paragraph 58(b) ........................................................ (1) (9)
Prepaid (accrued) pension cost in the statement of financial position .............. (70) (84)
(1) Group has reclassified an existing plan as a defined benefit plan due to requirement to cover for
shortfall in return on plan assets. This reclassification did not have a material impact on the
Group’s financial statements.
Present value of obligations include EUR 414 million (EUR 932 million in 2010) of wholly funded
obligations, EUR 1 260 million of partly funded obligations (EUR 567 million in 2010) and
EUR 63 million (EUR 45 million in 2010) of unfunded obligations.
F-31