Nokia 2011 Annual Report Download - page 159
Download and view the complete annual report
Please find page 159 of the 2011 Nokia annual report below. You can navigate through the pages in the report by either clicking on the pages listed below, or by using the keyword search tool below to find specific information within the annual report.-
 1
1 -
2
-
3
-
4
-
5
-
6
-
7
-
8
-
9
-
10
-
11
-
12
-
13
-
14
-
15
-
16
-
17
-
18
-
19
-
20
-
21
-
22
-
23
-
24
-
25
-
26
-
27
-
28
-
29
-
30
-
31
-
32
-
33
-
34
-
35
-
36
-
37
-
38
-
39
-
40
-
41
-
42
-
43
-
44
-
45
-
46
-
47
-
48
-
49
-
50
-
51
-
52
-
53
-
54
-
55
-
56
-
57
-
58
-
59
-
60
-
61
-
62
-
63
-
64
-
65
-
66
-
67
-
68
-
69
-
70
-
71
-
72
-
73
-
74
-
75
-
76
-
77
-
78
-
79
-
80
-
81
-
82
-
83
-
84
-
85
-
86
-
87
-
88
-
89
-
90
-
91
-
92
-
93
-
94
-
95
-
96
-
97
-
98
-
99
-
100
-
101
-
102
-
103
-
104
-
105
-
106
-
107
-
108
-
109
-
110
-
111
-
112
-
113
-
114
-
115
-
116
-
117
-
118
-
119
-
120
-
121
-
122
-
123
-
124
-
125
-
126
-
127
-
128
-
129
-
130
-
131
-
132
-
133
-
134
-
135
-
136
-
137
-
138
-
139
-
140
-
141
-
142
-
143
-
144
-
145
-
146
-
147
-
148
-
 149
149 -
 150
150 -
 151
151 -
 152
152 -
 153
153 -
 154
154 -
 155
155 -
 156
156 -
 157
157 -
 158
158 -
 159
159 -
 160
160 -
 161
161 -
 162
162 -
 163
163 -
 164
164 -
 165
165 -
 166
166 -
 167
167 -
 168
168 -
 169
169 -
170
-
171
-
172
-
173
-
174
-
175
-
176
-
177
-
178
-
179
-
180
-
181
-
182
-
183
-
184
-
185
-
186
-
187
-
188
-
189
-
190
-
191
-
192
-
193
-
194
-
195
-
196
-
197
-
198
-
199
-
200
-
201
-
202
-
203
-
204
-
205
-
206
-
207
-
208
-
209
-
210
-
211
-
212
-
213
-
214
-
215
-
216
-
217
-
218
-
219
-
220
-
221
-
222
-
223
-
224
-
225
-
226
-
227
-
228
-
229
-
230
-
231
-
232
-
233
-
234
-
235
-
236
-
237
-
238
-
239
-
240
-
241
-
242
-
243
-
244
-
245
-
246
-
247
-
248
-
249
-
250
-
251
-
252
-
253
-
254
-
255
-
256
-
257
-
258
-
259
-
260
-
261
-
262
-
263
-
264
-
265
-
266
-
267
-
268
-
269
-
270
-
271
-
272
-
273
-
274
-
275
-
276
-
277
-
278
-
279
-
280
-
281
-
282
-
283
-
284
-
285
-
286
-
287
-
288
-
289
-
290
-
291
-
292
-
293
-
294
-
295
-
296
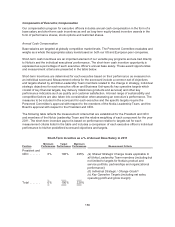
 |
 |

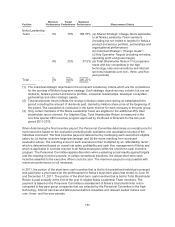
Position
Minimum
Performance
Target
Performance
Maximum
Performance Measurement Criteria
Nokia Leadership
Team ......... 0% 75% 168.75% (a) Shared Strategic Change Goals applicable
to all Nokia Leadership Team members
(including but not limited to targets for Nokia’s
product and service portfolio, partnerships and
organizational performance)
(b) Individual Strategic / Change Goals(1)
(c) Key Operative Targets (including net sales,
operating profit and gross margin)
0% 25% 37.5% (d) Total Shareholder Return(2)(3) (comparison
made with key competitors in the high
technology, telecommunications and Internet
services industries over one-, three- and five-
year periods)
Total .......... 0% 100% 206.25%
(1) The individual strategic objectives in the scorecard include key criteria which are the cornerstone
for the success of Nokia’s long-term strategy. Such strategic objectives may include, but are not
limited to, Nokia’s product and service portfolio, consumer relationships, developer ecosystem,
partnerships and other strategic assets.
(2) Total shareholder return reflects the change in Nokia’s share price during an established time
period, including the amount of dividends paid, divided by Nokia’s share price at the beginning of
the period. The calculation is conducted in the same manner for each company in the peer group.
(3) Only certain members of the Nokia Leadership Team are eligible for the additional 25% total
shareholder return element. For Stephen Elop, Total Shareholder Return is measured in the
one-time special CEO incentive program approved by the Board of Directors for the two-year
period 2011-2012.
When determining the final incentive payout, the Personnel Committee determines an overall score for
each executive based on the evaluation (including both qualitative and quantitative scores) of the
individual scorecard. The final incentive payout is determined by multiplying each executive’s eligible
salary by: (i) his/her incentive target percentage; and (ii) the score resulting from scorecard
evaluation above. The resulting score for each executive is then multiplied by an “affordability factor”,
which is determined based on overall net sales, profitability and cash flow management of Nokia and
which is applicable in a similar manner to all Nokia employees within the short-term cash incentive
program. The Personnel Committee applies discretion when evaluating actual results against targets
and the resulting incentive payouts. In certain exceptional situations, the actual short-term cash
incentive awarded to the executive officer could be zero. The maximum payout is only possible with
maximum performance on all measures.
In 2011, the portion of the short-term cash incentive that is tied to the predefined individual scorecard
was paid twice a year based on the performance for Nokia’s short-term plans that ended on June 30
and December 31, 2011. The portion of the short-term cash incentive that is tied to Total Shareholder
Return is paid annually at the end of the year to eligible Nokia Leadership Team members. The
payment is based on the Personnel Committee’s assessment of Nokia’s total shareholder return
compared to key peer group companies that are selected by the Personnel Committee in the high
technology, Internet services and telecommunications industries and relevant market indices over
one-, three- and five-year periods.
157