Nokia 2011 Annual Report Download - page 166
Download and view the complete annual report
Please find page 166 of the 2011 Nokia annual report below. You can navigate through the pages in the report by either clicking on the pages listed below, or by using the keyword search tool below to find specific information within the annual report.-
 1
1 -
2
-
3
-
4
-
5
-
6
-
7
-
8
-
9
-
10
-
11
-
12
-
13
-
14
-
15
-
16
-
17
-
18
-
19
-
20
-
21
-
22
-
23
-
24
-
25
-
26
-
27
-
28
-
29
-
30
-
31
-
32
-
33
-
34
-
35
-
36
-
37
-
38
-
39
-
40
-
41
-
42
-
43
-
44
-
45
-
46
-
47
-
48
-
49
-
50
-
51
-
52
-
53
-
54
-
55
-
56
-
57
-
58
-
59
-
60
-
61
-
62
-
63
-
64
-
65
-
66
-
67
-
68
-
69
-
70
-
71
-
72
-
73
-
74
-
75
-
76
-
77
-
78
-
79
-
80
-
81
-
82
-
83
-
84
-
85
-
86
-
87
-
88
-
89
-
90
-
91
-
92
-
93
-
94
-
95
-
96
-
97
-
98
-
99
-
100
-
101
-
102
-
103
-
104
-
105
-
106
-
107
-
108
-
109
-
110
-
111
-
112
-
113
-
114
-
115
-
116
-
117
-
118
-
119
-
120
-
121
-
122
-
123
-
124
-
125
-
126
-
127
-
128
-
129
-
130
-
131
-
132
-
133
-
134
-
135
-
136
-
137
-
138
-
139
-
140
-
141
-
142
-
143
-
144
-
145
-
146
-
147
-
148
-
149
-
150
-
151
-
152
-
153
-
154
-
155
-
 156
156 -
 157
157 -
 158
158 -
 159
159 -
 160
160 -
 161
161 -
 162
162 -
 163
163 -
 164
164 -
 165
165 -
 166
166 -
 167
167 -
 168
168 -
 169
169 -
 170
170 -
 171
171 -
 172
172 -
 173
173 -
 174
174 -
 175
175 -
 176
176 -
177
-
178
-
179
-
180
-
181
-
182
-
183
-
184
-
185
-
186
-
187
-
188
-
189
-
190
-
191
-
192
-
193
-
194
-
195
-
196
-
197
-
198
-
199
-
200
-
201
-
202
-
203
-
204
-
205
-
206
-
207
-
208
-
209
-
210
-
211
-
212
-
213
-
214
-
215
-
216
-
217
-
218
-
219
-
220
-
221
-
222
-
223
-
224
-
225
-
226
-
227
-
228
-
229
-
230
-
231
-
232
-
233
-
234
-
235
-
236
-
237
-
238
-
239
-
240
-
241
-
242
-
243
-
244
-
245
-
246
-
247
-
248
-
249
-
250
-
251
-
252
-
253
-
254
-
255
-
256
-
257
-
258
-
259
-
260
-
261
-
262
-
263
-
264
-
265
-
266
-
267
-
268
-
269
-
270
-
271
-
272
-
273
-
274
-
275
-
276
-
277
-
278
-
279
-
280
-
281
-
282
-
283
-
284
-
285
-
286
-
287
-
288
-
289
-
290
-
291
-
292
-
293
-
294
-
295
-
296
 |
 |
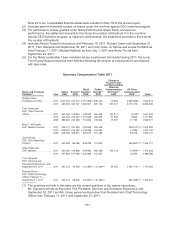
(2) The fair value of stock options equals the estimated fair value on the grant date, calculated using
the Black-Scholes model. The stock option exercise price was EUR 6.02 on May 13, 2011 and
EUR 3.76 on August 5, 2011. NASDAQ OMX Helsinki closing market price was EUR 6.02 at grant
date on May 13, 2011 and EUR 3.56 on August 5, 2011.
(3) The fair value of performance shares and restricted shares equals the estimated fair value on
grant date. The estimated fair value is based on the grant date market price of the Nokia share
less the present value of dividends expected to be paid during the vesting period. The value of
performance shares is presented on the basis of a number of shares, which is two times the
number at threshold.
(4) Represents the threshold and maximum number of shares under the one-time special CEO
incentive program granted on March 11, 2011.
(5) The fair value of the one-time special CEO incentive program equals the estimated fair value on
the grant date, calculated using the Black-Scholes model and taking into consideration the two
performance criteria, Nokia’s share price both on an absolute basis and relative to a peer group,
as defined by the incentive program rules. NASDAQ OMX Helsinki closing market price at grant
date on March 11, 2011 was EUR 6.08.
(6) Mr. Green’s and Mr. Ojanperä’s equity grants were forfeited and cancelled upon their respective
terminations of employment in accordance with plan rules.
For information with respect to the Nokia shares and equity awards held by the members of the Nokia
Leadership Team as at December 31, 2011, please see Item 6E. “Share Ownership.”
Equity-Based Incentive Programs
General
During the year ended December 31, 2011, we administered three global stock option plans, four
global performance share plans and four global restricted share plans. Both executives and employees
participate in these plans. Our compensation programs promote long-term value creation and
sustainability of the company and ensure that remuneration is based on performance. Performance
shares have been the main element of the company’s broad-based equity compensation program to
further emphasize the performance element in employees’ long-term incentives. For managers and
employees in higher job levels we employ a portfolio approach designed to build an optimal and
balanced combination of long-term equity-based incentives, by granting both performance shares and
stock options. We believe using both equity instruments help focus recipients on long term financial
performance as well as on share price appreciation, thus aligning recipients’ interests with those of
shareholders’ and promoting the long-term financial success of the company. The equity-based
compensation programs are intended to align the potential value received by participants directly with
the performance of Nokia. We have also granted restricted shares to a small selected number of key
employees considered key talent whose retention or recruitment is vital to the future success of Nokia.
The equity-based incentive grants are generally conditioned upon continued employment with Nokia,
as well as the fulfillment of performance and other conditions, as determined in the relevant plan rules.
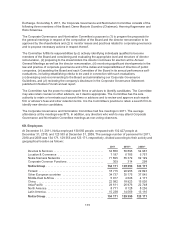
The equity program for 2011, which was approved by the Board of Directors, followed the structure of the
program in 2010. The participant group for the 2011 equity-based incentive program continued to be
broad, with a wide number of employees in many levels of the organization eligible to participate. As at
December 31, 2011, the aggregate number of participants in all of our active equity-based programs was
approximately 9 300 compared with approximately 11 500 as at December 31, 2010 reflecting changes in
our grant guidelines and reduction in eligible population.
For a more detailed description of all of our equity-based incentive plans, see Note 24 to our
consolidated financial statements included in Item 18 of this annual report.
164