Nokia 2011 Annual Report Download - page 182
Download and view the complete annual report
Please find page 182 of the 2011 Nokia annual report below. You can navigate through the pages in the report by either clicking on the pages listed below, or by using the keyword search tool below to find specific information within the annual report.-
 1
1 -
2
-
3
-
4
-
5
-
6
-
7
-
8
-
9
-
10
-
11
-
12
-
13
-
14
-
15
-
16
-
17
-
18
-
19
-
20
-
21
-
22
-
23
-
24
-
25
-
26
-
27
-
28
-
29
-
30
-
31
-
32
-
33
-
34
-
35
-
36
-
37
-
38
-
39
-
40
-
41
-
42
-
43
-
44
-
45
-
46
-
47
-
48
-
49
-
50
-
51
-
52
-
53
-
54
-
55
-
56
-
57
-
58
-
59
-
60
-
61
-
62
-
63
-
64
-
65
-
66
-
67
-
68
-
69
-
70
-
71
-
72
-
73
-
74
-
75
-
76
-
77
-
78
-
79
-
80
-
81
-
82
-
83
-
84
-
85
-
86
-
87
-
88
-
89
-
90
-
91
-
92
-
93
-
94
-
95
-
96
-
97
-
98
-
99
-
100
-
101
-
102
-
103
-
104
-
105
-
106
-
107
-
108
-
109
-
110
-
111
-
112
-
113
-
114
-
115
-
116
-
117
-
118
-
119
-
120
-
121
-
122
-
123
-
124
-
125
-
126
-
127
-
128
-
129
-
130
-
131
-
132
-
133
-
134
-
135
-
136
-
137
-
138
-
139
-
140
-
141
-
142
-
143
-
144
-
145
-
146
-
147
-
148
-
149
-
150
-
151
-
152
-
153
-
154
-
155
-
156
-
157
-
158
-
159
-
160
-
161
-
162
-
163
-
164
-
165
-
166
-
167
-
168
-
169
-
170
-
171
-
 172
172 -
 173
173 -
 174
174 -
 175
175 -
 176
176 -
 177
177 -
 178
178 -
 179
179 -
 180
180 -
 181
181 -
 182
182 -
 183
183 -
 184
184 -
 185
185 -
 186
186 -
 187
187 -
 188
188 -
 189
189 -
 190
190 -
 191
191 -
 192
192 -
193
-
194
-
195
-
196
-
197
-
198
-
199
-
200
-
201
-
202
-
203
-
204
-
205
-
206
-
207
-
208
-
209
-
210
-
211
-
212
-
213
-
214
-
215
-
216
-
217
-
218
-
219
-
220
-
221
-
222
-
223
-
224
-
225
-
226
-
227
-
228
-
229
-
230
-
231
-
232
-
233
-
234
-
235
-
236
-
237
-
238
-
239
-
240
-
241
-
242
-
243
-
244
-
245
-
246
-
247
-
248
-
249
-
250
-
251
-
252
-
253
-
254
-
255
-
256
-
257
-
258
-
259
-
260
-
261
-
262
-
263
-
264
-
265
-
266
-
267
-
268
-
269
-
270
-
271
-
272
-
273
-
274
-
275
-
276
-
277
-
278
-
279
-
280
-
281
-
282
-
283
-
284
-
285
-
286
-
287
-
288
-
289
-
290
-
291
-
292
-
293
-
294
-
295
-
296
 |
 |

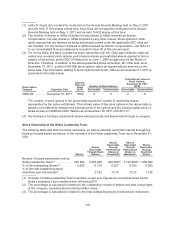
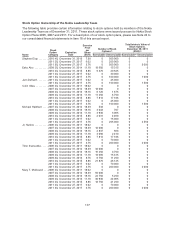
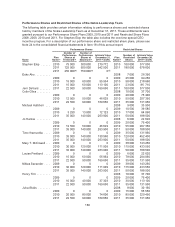
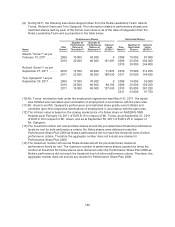
Performance Shares and Restricted Shares of the Nokia Leadership Team
The following table provides certain information relating to performance shares and restricted shares
held by members of the Nokia Leadership Team as at December 31, 2011. These entitlements were
granted pursuant to our Performance Share Plans 2009, 2010 and 2011 and Restricted Share Plans
2008, 2009, 2010 and 2011. For Stephen Elop the table also includes the one-time special CEO
incentive program. For a description of our performance share and restricted share plans, please see
Note 24 to the consolidated financial statements in Item 18 of this annual report.
Performance Shares Restricted Shares
Name
Plan
Name(1)
Number of
Performance
Shares at
Threshold(2)
Number of
Performance
Shares at
Maximum(3)
Intrinsic Value
December 31,
2011(5) (EUR)
Plan
Name(7)
Number of
Restricted
Shares
Intrinsic Value
December 30,
2011(8) (EUR)
Stephen Elop ...... 2010 75 000 300 000 279 772 2010 100 000 377 000
2011 125 000 500 000 942 500 2011 180 000 678 600
2011 250 000(4) 750 000(4) 0(6)
Esko Aho .......... 2008 7 000 26 390
2009 0 0 0 2009 25 000 94 250
2010 15 000 60 000 55 954 2010 58 000 218 660
2011 15 000 60 000 113 100 2011 23 000 86 710
Jerri DeVard ....... 2011 22 500 90 000 169 650 2011 100 000 377 000
Colin Giles ......... 2008 10 000 37 700
2009 0 0 0 2009 20 000 75 400
2010 12 500 50 000 46 629 2010 55 000 207 350
2011 22 500 90 000 169 650 2011 35 000 131 950
Michael Halbherr . . . 2008 9 000 33 930
2009 0 0 0 2009 10 500 39 585
2010 3 250 13 000 12 123 2010 17 000 64 090
2011 35 000 140 000 263 900 2011 50 000 188 500
Jo Harlow ......... 2008 6 000 22 620
2009 0 0 0 2009 20 000 75 400
2010 12 500 50 000 46 629 2010 55 000 207 350
2011 35 000 140 000 263 900 2011 50 000 188 500
Timo Ihamuotila .... 2009 0 0 0 2009 35 000 131 950
2010 35 000 140 000 130 560 2010 120 000 452 400
2011 35 000 140 000 263 900 2011 50 000 188 500
Mary T. McDowell . . . 2009 0 0 0 2009 38 000 143 260
2010 30 000 120 000 111 909 2010 115 000 433 550
2011 35 000 140 000 263 900 2011 50 000 188 500
Louise Pentland .... 2009 0 0 0 2009 6 000 22 620
2010 15 000 60 000 55 954 2010 78 000 294 060
2011 22 500 90 000 169 650 2011 35 000 131 950
Niklas Savander .... 2009 0 0 0 2009 38 000 143 260
2010 30 000 120 000 111 909 2010 115 000 433 550
2011 35 000 140 000 263 900 2011 50 000 188 500
Henry Tirri ......... 2008 10 000 37 700
2009 0 0 0 2009 20 000 75 400
2010 10 000 40 000 37 303 2010 30 000 113 100
2011 22 500 90 000 169 650 2011 35 000 131 950
Juha Äkräs ........ 2008 8 000 30 160
2009 0 0 0 2009 15 000 56 550
2010 20 000 80 000 74 606 2010 85 000 320 450
2011 22 500 90 000 169 650 2011 35 000 131 950
180