Nokia 2011 Annual Report Download - page 212
Download and view the complete annual report
Please find page 212 of the 2011 Nokia annual report below. You can navigate through the pages in the report by either clicking on the pages listed below, or by using the keyword search tool below to find specific information within the annual report.-
 1
1 -
2
-
3
-
4
-
5
-
6
-
7
-
8
-
9
-
10
-
11
-
12
-
13
-
14
-
15
-
16
-
17
-
18
-
19
-
20
-
21
-
22
-
23
-
24
-
25
-
26
-
27
-
28
-
29
-
30
-
31
-
32
-
33
-
34
-
35
-
36
-
37
-
38
-
39
-
40
-
41
-
42
-
43
-
44
-
45
-
46
-
47
-
48
-
49
-
50
-
51
-
52
-
53
-
54
-
55
-
56
-
57
-
58
-
59
-
60
-
61
-
62
-
63
-
64
-
65
-
66
-
67
-
68
-
69
-
70
-
71
-
72
-
73
-
74
-
75
-
76
-
77
-
78
-
79
-
80
-
81
-
82
-
83
-
84
-
85
-
86
-
87
-
88
-
89
-
90
-
91
-
92
-
93
-
94
-
95
-
96
-
97
-
98
-
99
-
100
-
101
-
102
-
103
-
104
-
105
-
106
-
107
-
108
-
109
-
110
-
111
-
112
-
113
-
114
-
115
-
116
-
117
-
118
-
119
-
120
-
121
-
122
-
123
-
124
-
125
-
126
-
127
-
128
-
129
-
130
-
131
-
132
-
133
-
134
-
135
-
136
-
137
-
138
-
139
-
140
-
141
-
142
-
143
-
144
-
145
-
146
-
147
-
148
-
149
-
150
-
151
-
152
-
153
-
154
-
155
-
156
-
157
-
158
-
159
-
160
-
161
-
162
-
163
-
164
-
165
-
166
-
167
-
168
-
169
-
170
-
171
-
172
-
173
-
174
-
175
-
176
-
177
-
178
-
179
-
180
-
181
-
182
-
183
-
184
-
185
-
186
-
187
-
188
-
189
-
190
-
191
-
192
-
193
-
194
-
195
-
196
-
197
-
198
-
199
-
200
-
201
-
 202
202 -
 203
203 -
 204
204 -
 205
205 -
 206
206 -
 207
207 -
 208
208 -
 209
209 -
 210
210 -
 211
211 -
 212
212 -
 213
213 -
 214
214 -
 215
215 -
 216
216 -
 217
217 -
 218
218 -
 219
219 -
 220
220 -
 221
221 -
 222
222 -
223
-
224
-
225
-
226
-
227
-
228
-
229
-
230
-
231
-
232
-
233
-
234
-
235
-
236
-
237
-
238
-
239
-
240
-
241
-
242
-
243
-
244
-
245
-
246
-
247
-
248
-
249
-
250
-
251
-
252
-
253
-
254
-
255
-
256
-
257
-
258
-
259
-
260
-
261
-
262
-
263
-
264
-
265
-
266
-
267
-
268
-
269
-
270
-
271
-
272
-
273
-
274
-
275
-
276
-
277
-
278
-
279
-
280
-
281
-
282
-
283
-
284
-
285
-
286
-
287
-
288
-
289
-
290
-
291
-
292
-
293
-
294
-
295
-
296
 |
 |

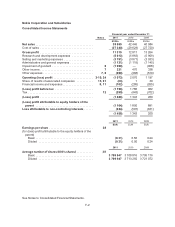
Nokia Corporation and Subsidiaries
Consolidated Income Statements
Notes
Financial year ended December 31
2011 2010 2009
EURm EURm EURm
Net sales ...................................... 38 659 42 446 40 984
Cost of sales ................................... (27 340) (29 629) (27 720)
Gross profit ................................... 11 319 12 817 13 264
Research and development expenses .............. (5 612) (5 863) (5 909)
Selling and marketing expenses ................... (3 791) (3 877) (3 933)
Administrative and general expenses ............... (1 121) (1 115) (1 145)
Impairment of goodwill ........................... 8 (1 090) — (908)
Other income ................................... 7 221 476 338
Other expenses ................................. 7, 8 (999) (368) (510)
Operating (loss) profit .......................... 2-10, 24 (1 073) 2 070 1 197
Share of results of associated companies ........... 15, 31 (23) 130
Financial income and expenses .................... 8, 11 (102) (285) (265)
(Loss) profit before tax ......................... (1 198) 1 786 962
Tax........................................... 12 (290) (443) (702)
(Loss) profit ................................... (1 488) 1 343 260
(Loss) profit attributable to equity holders of the
parent ...................................... (1 164) 1 850 891
Loss attributable to non-controlling interests ...... (324) (507) (631)
(1 488) 1 343 260
2011 2010 2009
EUR EUR EUR
Earnings per share ............................. 28
(for (loss) profit attributable to the equity holders of the
parent)
Basic ...................................... (0.31) 0.50 0.24
Diluted .................................... (0.31) 0.50 0.24
2011 2010 2009
Average number of shares (000’s shares) ........... 28
Basic ...................................... 3 709 947 3 708 816 3 705 116
Diluted .................................... 3 709 947 3 713 250 3 721 072
See Notes to Consolidated Financial Statements.
F-2