Nokia 2011 Annual Report Download - page 270
Download and view the complete annual report
Please find page 270 of the 2011 Nokia annual report below. You can navigate through the pages in the report by either clicking on the pages listed below, or by using the keyword search tool below to find specific information within the annual report.-
 1
1 -
2
-
3
-
4
-
5
-
6
-
7
-
8
-
9
-
10
-
11
-
12
-
13
-
14
-
15
-
16
-
17
-
18
-
19
-
20
-
21
-
22
-
23
-
24
-
25
-
26
-
27
-
28
-
29
-
30
-
31
-
32
-
33
-
34
-
35
-
36
-
37
-
38
-
39
-
40
-
41
-
42
-
43
-
44
-
45
-
46
-
47
-
48
-
49
-
50
-
51
-
52
-
53
-
54
-
55
-
56
-
57
-
58
-
59
-
60
-
61
-
62
-
63
-
64
-
65
-
66
-
67
-
68
-
69
-
70
-
71
-
72
-
73
-
74
-
75
-
76
-
77
-
78
-
79
-
80
-
81
-
82
-
83
-
84
-
85
-
86
-
87
-
88
-
89
-
90
-
91
-
92
-
93
-
94
-
95
-
96
-
97
-
98
-
99
-
100
-
101
-
102
-
103
-
104
-
105
-
106
-
107
-
108
-
109
-
110
-
111
-
112
-
113
-
114
-
115
-
116
-
117
-
118
-
119
-
120
-
121
-
122
-
123
-
124
-
125
-
126
-
127
-
128
-
129
-
130
-
131
-
132
-
133
-
134
-
135
-
136
-
137
-
138
-
139
-
140
-
141
-
142
-
143
-
144
-
145
-
146
-
147
-
148
-
149
-
150
-
151
-
152
-
153
-
154
-
155
-
156
-
157
-
158
-
159
-
160
-
161
-
162
-
163
-
164
-
165
-
166
-
167
-
168
-
169
-
170
-
171
-
172
-
173
-
174
-
175
-
176
-
177
-
178
-
179
-
180
-
181
-
182
-
183
-
184
-
185
-
186
-
187
-
188
-
189
-
190
-
191
-
192
-
193
-
194
-
195
-
196
-
197
-
198
-
199
-
200
-
201
-
202
-
203
-
204
-
205
-
206
-
207
-
208
-
209
-
210
-
211
-
212
-
213
-
214
-
215
-
216
-
217
-
218
-
219
-
220
-
221
-
222
-
223
-
224
-
225
-
226
-
227
-
228
-
229
-
230
-
231
-
232
-
233
-
234
-
235
-
236
-
237
-
238
-
239
-
240
-
241
-
242
-
243
-
244
-
245
-
246
-
247
-
248
-
249
-
250
-
251
-
252
-
253
-
254
-
255
-
256
-
257
-
258
-
259
-
 260
260 -
 261
261 -
 262
262 -
 263
263 -
 264
264 -
 265
265 -
 266
266 -
 267
267 -
 268
268 -
 269
269 -
 270
270 -
 271
271 -
 272
272 -
 273
273 -
 274
274 -
 275
275 -
 276
276 -
 277
277 -
 278
278 -
 279
279 -
 280
280 -
281
-
282
-
283
-
284
-
285
-
286
-
287
-
288
-
289
-
290
-
291
-
292
-
293
-
294
-
295
-
296
 |
 |

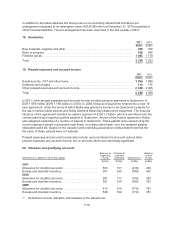
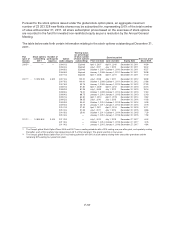
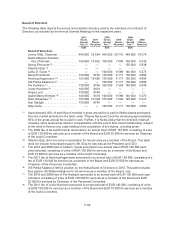
The following table sets forth the performance criteria of each global performance share plan.
Threshold Performance Maximum Performance
Plan EPS(1)(2)
Average Annual
Net Sales Growth(1) EPS(1)(2)
Average Annual
Net Sales Growth(1)
EUR EUR
2008 .................................... 1.72 4% 2.76 16%
2009 .................................... 1.01 (5)% 1.53 10%
2010 .................................... 0.82 0% 1.44 13.5%
2011 .................................... 0.50 2.5% 1.10 10%
(1) Both the EPS and Average Annual Net Sales Growth criteria have an equal weight of 50%.
(2) Performance Share Plans of 2008, 2009 and 2010: EPS at the end of the performance period.
Performance Share Plan 2011: average annual EPS. The EPS for 2008 plan: diluted excluding
special items. The EPS for 2009, 2010 and 2011 plans: diluted non-IFRS.
Performance Shares Outstanding at December 31, 2011 (1)
Number of
performance
shares at
threshold
Weighted
average grant
date fair value
EUR(2)
Performance shares at January 1, 2009 ............................ 8 035 219
Granted ........................................................ 2960110 9.57
Forfeited ....................................................... 691325
Vested (3), (4) .................................................... 5210044
Performance shares at December 31, 2009 ......................... 5 093 960
Granted ........................................................ 3576403 5.94
Forfeited ....................................................... 1039908
Vested (5) ....................................................... 1910332
Performance shares at December 31, 2010 ......................... 5 720 123
Granted ........................................................ 5410211 3.66
Forfeited ....................................................... 1538377
Vested (6) ....................................................... 2009423
Performance shares at December 31, 2011 ......................... 7 582 534
(1) Includes also performance shares granted under other than global equity plans. For further
information see “Other equity plans for employees” below.
(2) The fair value of performance shares is estimated based on the grant date market price of the
Company’s share less the present value of dividends, if any, expected to be paid during the
vesting period.
(3) Based on the performance of the Group during the Interim Measurement Period 2005 - 2006,
under the 2005 Performance Share Plan, both performance criteria were met. Hence, 3 980 572
Nokia shares equaling the threshold number were delivered in 2007. The final payout, in 2009,
was adjusted by the shares delivered based on the Interim Measurement Period.
(4) Includes performance shares under Performance Share plan 2007 that vested on December 31,
2009.
(5) Includes performance shares under Performance Share plan 2008 that vested on December 31,
2010.
(6) Includes performance shares under Performance Share plan 2009 that vested on December 31,
2011.
F-60