Nokia 2011 Annual Report Download - page 285
Download and view the complete annual report
Please find page 285 of the 2011 Nokia annual report below. You can navigate through the pages in the report by either clicking on the pages listed below, or by using the keyword search tool below to find specific information within the annual report.-
 1
1 -
2
-
3
-
4
-
5
-
6
-
7
-
8
-
9
-
10
-
11
-
12
-
13
-
14
-
15
-
16
-
17
-
18
-
19
-
20
-
21
-
22
-
23
-
24
-
25
-
26
-
27
-
28
-
29
-
30
-
31
-
32
-
33
-
34
-
35
-
36
-
37
-
38
-
39
-
40
-
41
-
42
-
43
-
44
-
45
-
46
-
47
-
48
-
49
-
50
-
51
-
52
-
53
-
54
-
55
-
56
-
57
-
58
-
59
-
60
-
61
-
62
-
63
-
64
-
65
-
66
-
67
-
68
-
69
-
70
-
71
-
72
-
73
-
74
-
75
-
76
-
77
-
78
-
79
-
80
-
81
-
82
-
83
-
84
-
85
-
86
-
87
-
88
-
89
-
90
-
91
-
92
-
93
-
94
-
95
-
96
-
97
-
98
-
99
-
100
-
101
-
102
-
103
-
104
-
105
-
106
-
107
-
108
-
109
-
110
-
111
-
112
-
113
-
114
-
115
-
116
-
117
-
118
-
119
-
120
-
121
-
122
-
123
-
124
-
125
-
126
-
127
-
128
-
129
-
130
-
131
-
132
-
133
-
134
-
135
-
136
-
137
-
138
-
139
-
140
-
141
-
142
-
143
-
144
-
145
-
146
-
147
-
148
-
149
-
150
-
151
-
152
-
153
-
154
-
155
-
156
-
157
-
158
-
159
-
160
-
161
-
162
-
163
-
164
-
165
-
166
-
167
-
168
-
169
-
170
-
171
-
172
-
173
-
174
-
175
-
176
-
177
-
178
-
179
-
180
-
181
-
182
-
183
-
184
-
185
-
186
-
187
-
188
-
189
-
190
-
191
-
192
-
193
-
194
-
195
-
196
-
197
-
198
-
199
-
200
-
201
-
202
-
203
-
204
-
205
-
206
-
207
-
208
-
209
-
210
-
211
-
212
-
213
-
214
-
215
-
216
-
217
-
218
-
219
-
220
-
221
-
222
-
223
-
224
-
225
-
226
-
227
-
228
-
229
-
230
-
231
-
232
-
233
-
234
-
235
-
236
-
237
-
238
-
239
-
240
-
241
-
242
-
243
-
244
-
245
-
246
-
247
-
248
-
249
-
250
-
251
-
252
-
253
-
254
-
255
-
256
-
257
-
258
-
259
-
260
-
261
-
262
-
263
-
264
-
265
-
266
-
267
-
268
-
269
-
270
-
271
-
272
-
273
-
274
-
 275
275 -
 276
276 -
 277
277 -
 278
278 -
 279
279 -
 280
280 -
 281
281 -
 282
282 -
 283
283 -
 284
284 -
 285
285 -
 286
286 -
 287
287 -
 288
288 -
 289
289 -
 290
290 -
 291
291 -
 292
292 -
 293
293 -
 294
294 -
 295
295 -
296
 |
 |

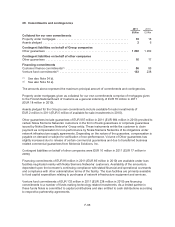
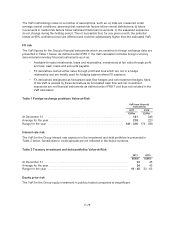
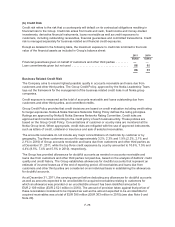
The VaR methodology relies on a number of assumptions, such as, a) risks are measured under
average market conditions, assuming that market risk factors follow normal distributions; b) future
movements in market risk factors follow estimated historical movements; c) the assessed exposures
do not change during the holding period. Thus it is possible that, for any given month, the potential
losses at 95% confidence level are different and could be substantially higher than the estimated VaR.
FX risk
The VaR figures for the Group’s financial instruments which are sensitive to foreign exchange risks are
presented in Table 1 below. As defined under IFRS 7, the VaR calculation includes foreign currency
denominated monetary financial instruments such as:
• Available-for-sale investments, loans and receivables, investments at fair value through profit
and loss, cash, loans and accounts payable.
• FX derivatives carried at fair value through profit and loss which are not in a hedge
relationship and are mostly used for hedging balance sheet FX exposure.
• FX derivatives designated as forecasted cash flow hedges and net investment hedges. Most
of the VaR is caused by these derivatives as forecasted cash flow and net investment
exposures are not financial instruments as defined under IFRS 7 and thus not included in the
VaR calculation.
Table 1 Foreign exchange positions Value-at-Risk
VaR from financial
instruments
2011 2010
EURm EURm
At December 31 .................................................... 141 245
Average for the year ................................................. 218 223
Range for the year .................................................. 141 - 316 174 - 299
Interest rate risk
The VaR for the Group interest rate exposure in the investment and debt portfolios is presented in
Table 2 below. Sensitivities to credit spreads are not reflected in the below numbers.
Table 2 Treasury investment and debt portfolios Value-at-Risk
2011 2010
EURm EURm
At December 31 ....................................................... 33 45
Average for the year .................................................... 34 43
Range for the year ..................................................... 19 - 45 33 - 63
Equity price risk
The VaR for the Group equity investment in publicly traded companies is insignificant.
F-75