Nokia 2011 Annual Report Download - page 132
Download and view the complete annual report
Please find page 132 of the 2011 Nokia annual report below. You can navigate through the pages in the report by either clicking on the pages listed below, or by using the keyword search tool below to find specific information within the annual report.-
 1
1 -
2
-
3
-
4
-
5
-
6
-
7
-
8
-
9
-
10
-
11
-
12
-
13
-
14
-
15
-
16
-
17
-
18
-
19
-
20
-
21
-
22
-
23
-
24
-
25
-
26
-
27
-
28
-
29
-
30
-
31
-
32
-
33
-
34
-
35
-
36
-
37
-
38
-
39
-
40
-
41
-
42
-
43
-
44
-
45
-
46
-
47
-
48
-
49
-
50
-
51
-
52
-
53
-
54
-
55
-
56
-
57
-
58
-
59
-
60
-
61
-
62
-
63
-
64
-
65
-
66
-
67
-
68
-
69
-
70
-
71
-
72
-
73
-
74
-
75
-
76
-
77
-
78
-
79
-
80
-
81
-
82
-
83
-
84
-
85
-
86
-
87
-
88
-
89
-
90
-
91
-
92
-
93
-
94
-
95
-
96
-
97
-
98
-
99
-
100
-
101
-
102
-
103
-
104
-
105
-
106
-
107
-
108
-
109
-
110
-
111
-
112
-
113
-
114
-
115
-
116
-
117
-
118
-
119
-
120
-
121
-
 122
122 -
 123
123 -
 124
124 -
 125
125 -
 126
126 -
 127
127 -
 128
128 -
 129
129 -
 130
130 -
 131
131 -
 132
132 -
 133
133 -
 134
134 -
 135
135 -
 136
136 -
 137
137 -
 138
138 -
 139
139 -
 140
140 -
 141
141 -
 142
142 -
143
-
144
-
145
-
146
-
147
-
148
-
149
-
150
-
151
-
152
-
153
-
154
-
155
-
156
-
157
-
158
-
159
-
160
-
161
-
162
-
163
-
164
-
165
-
166
-
167
-
168
-
169
-
170
-
171
-
172
-
173
-
174
-
175
-
176
-
177
-
178
-
179
-
180
-
181
-
182
-
183
-
184
-
185
-
186
-
187
-
188
-
189
-
190
-
191
-
192
-
193
-
194
-
195
-
196
-
197
-
198
-
199
-
200
-
201
-
202
-
203
-
204
-
205
-
206
-
207
-
208
-
209
-
210
-
211
-
212
-
213
-
214
-
215
-
216
-
217
-
218
-
219
-
220
-
221
-
222
-
223
-
224
-
225
-
226
-
227
-
228
-
229
-
230
-
231
-
232
-
233
-
234
-
235
-
236
-
237
-
238
-
239
-
240
-
241
-
242
-
243
-
244
-
245
-
246
-
247
-
248
-
249
-
250
-
251
-
252
-
253
-
254
-
255
-
256
-
257
-
258
-
259
-
260
-
261
-
262
-
263
-
264
-
265
-
266
-
267
-
268
-
269
-
270
-
271
-
272
-
273
-
274
-
275
-
276
-
277
-
278
-
279
-
280
-
281
-
282
-
283
-
284
-
285
-
286
-
287
-
288
-
289
-
290
-
291
-
292
-
293
-
294
-
295
-
296
 |
 |

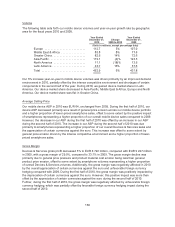
Volume
The following table sets forth our mobile device volumes and year-on-year growth rate by geographic
area for the fiscal years 2010 and 2009.
Year Ended
December 31,
2010
Change
2009 to 2010
Year Ended
December 31,
2009
(Units in millions, except percentage data)
Europe ........................... 112.7 5% 107.0
Middle East & Africa ................ 83.8 8% 77.6
Greater China ...................... 82.5 14% 72.6
Asia-Pacific ........................ 119.1 (4)% 123.5
North America ..................... 11.1 (18)% 13.5
Latin America ...................... 43.7 16% 37.6
Total ............................. 452.9 5% 431.8
Our 5% increase year-on-year in mobile device volumes was driven primarily by an improved demand
environment in 2010, partially offset by the intense competitive environment and shortages of certain
components in the second half of the year. During 2010, we gained device market share in Latin
America. Our device market share decreased in Asia-Pacific, Middle East & Africa, Europe and North
America. Our device market share was flat in Greater China.
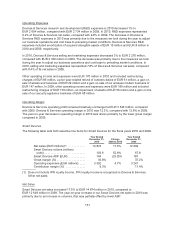
Average Selling Price
Our mobile device ASP in 2010 was EUR 64, unchanged from 2009. During the first half of 2010, our
device ASP decreased primarily as a result of general price erosion across our mobile device portfolio
and a higher proportion of lower-priced smartphone sales, offset to some extent by the positive impact
of smartphones representing a higher proportion of our overall mobile device sales compared to 2009.
However, the decrease in our ASP during the first half of 2010 was offset by an increase in our ASP
during the second half of 2010. The increase in our ASP during the second half of 2010 was due
primarily to smartphones representing a higher proportion of our overall Devices & Services sales and
the appreciation of certain currencies against the euro. This increase was offset to some extent by
general price erosion driven by the intense competitive environment and a higher proportion of lower-
priced smartphone sales.
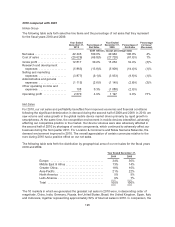
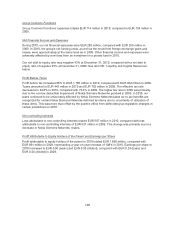
Gross Margin
Devices & Services gross profit decreased 5% to EUR 8 722 million, compared with EUR 9 227 million
in 2009, with a gross margin of 29.9%, compared to 33.1% in 2009. The gross margin decline was
primarily due to general price pressure and product material cost erosion being less than general
product price erosion, offset to some extent by smartphone volumes representing a higher proportion
of overall Devices & Services volumes. Additionally, the gross margin was negatively affected in 2010
by the overall appreciation of certain currencies against the euro and unfavorable foreign currency
hedging compared with 2009. During the first half of 2010, the gross margin was positively impacted by
the depreciation of certain currencies against the euro. However, this positive impact was more than
offset by the appreciation of certain currencies against the euro during the second half of 2010.
Further, during the first half of 2010, the gross margin was negatively affected by unfavorable foreign
currency hedging, which was partially offset by favorable foreign currency hedging impact during the
second half of 2010.
130