Nokia 2011 Annual Report Download - page 122
Download and view the complete annual report
Please find page 122 of the 2011 Nokia annual report below. You can navigate through the pages in the report by either clicking on the pages listed below, or by using the keyword search tool below to find specific information within the annual report.-
 1
1 -
 2
2 -
 3
3 -
 4
4 -
 5
5 -
 6
6 -
 7
7 -
 8
8 -
 9
9 -
 10
10 -
 11
11 -
 12
12 -
 13
13 -
 14
14 -
 15
15 -
 16
16 -
 17
17 -
 18
18 -
 19
19 -
 20
20 -
 21
21 -
 22
22 -
 23
23 -
 24
24 -
 25
25 -
 26
26 -
 27
27 -
 28
28 -
 29
29 -
 30
30 -
 31
31 -
 32
32 -
 33
33 -
 34
34 -
 35
35 -
 36
36 -
 37
37 -
 38
38 -
 39
39 -
 40
40 -
 41
41 -
 42
42 -
 43
43 -
 44
44 -
 45
45 -
 46
46 -
 47
47 -
 48
48 -
 49
49 -
 50
50 -
 51
51 -
 52
52 -
 53
53 -
 54
54 -
 55
55 -
 56
56 -
 57
57 -
 58
58 -
 59
59 -
 60
60 -
 61
61 -
 62
62 -
 63
63 -
 64
64 -
 65
65 -
 66
66 -
 67
67 -
 68
68 -
 69
69 -
 70
70 -
 71
71 -
 72
72 -
 73
73 -
 74
74 -
 75
75 -
 76
76 -
 77
77 -
 78
78 -
 79
79 -
 80
80 -
 81
81 -
 82
82 -
 83
83 -
 84
84 -
 85
85 -
 86
86 -
 87
87 -
 88
88 -
 89
89 -
 90
90 -
 91
91 -
 92
92 -
 93
93 -
 94
94 -
 95
95 -
 96
96 -
 97
97 -
 98
98 -
 99
99 -
 100
100 -
 101
101 -
 102
102 -
 103
103 -
 104
104 -
 105
105 -
 106
106 -
 107
107 -
 108
108 -
 109
109 -
 110
110 -
 111
111 -
 112
112 -
 113
113 -
 114
114 -
 115
115 -
 116
116 -
 117
117 -
 118
118 -
 119
119 -
 120
120 -
 121
121 -
 122
122 -
 123
123 -
 124
124 -
 125
125 -
 126
126 -
 127
127 -
 128
128 -
 129
129 -
 130
130 -
 131
131 -
 132
132 -
 133
133 -
 134
134 -
 135
135 -
 136
136 -
 137
137 -
 138
138 -
 139
139 -
 140
140 -
 141
141 -
 142
142 -
 143
143 -
 144
144 -
 145
145 -
 146
146 -
 147
147 -
 148
148 -
 149
149 -
 150
150 -
 151
151 -
 152
152 -
 153
153 -
 154
154 -
 155
155 -
 156
156 -
 157
157 -
 158
158 -
 159
159 -
 160
160 -
 161
161 -
 162
162 -
 163
163 -
 164
164 -
 165
165 -
 166
166 -
 167
167 -
 168
168 -
 169
169 -
 170
170 -
 171
171 -
 172
172 -
 173
173 -
 174
174 -
 175
175 -
 176
176 -
 177
177 -
 178
178 -
 179
179 -
 180
180 -
 181
181 -
 182
182 -
 183
183 -
 184
184 -
 185
185 -
 186
186 -
 187
187 -
 188
188 -
 189
189 -
 190
190 -
 191
191 -
 192
192 -
 193
193 -
 194
194 -
 195
195 -
 196
196 -
 197
197 -
 198
198 -
 199
199 -
 200
200 -
 201
201 -
 202
202 -
 203
203 -
 204
204 -
 205
205 -
 206
206 -
 207
207 -
 208
208 -
 209
209 -
 210
210 -
 211
211 -
 212
212 -
 213
213 -
 214
214 -
 215
215 -
 216
216 -
 217
217 -
 218
218 -
 219
219 -
 220
220 -
 221
221 -
 222
222 -
 223
223 -
 224
224 -
 225
225 -
 226
226 -
 227
227 -
 228
228 -
 229
229 -
 230
230 -
 231
231 -
 232
232 -
 233
233 -
 234
234 -
 235
235 -
 236
236 -
 237
237 -
 238
238 -
 239
239 -
 240
240 -
 241
241 -
 242
242 -
 243
243 -
 244
244 -
 245
245 -
 246
246 -
 247
247 -
 248
248 -
 249
249 -
 250
250 -
 251
251 -
 252
252 -
 253
253 -
 254
254 -
 255
255 -
 256
256 -
 257
257 -
 258
258 -
 259
259 -
 260
260 -
 261
261 -
 262
262 -
 263
263 -
 264
264 -
 265
265 -
 266
266 -
 267
267 -
 268
268 -
 269
269 -
 270
270 -
 271
271 -
 272
272 -
 273
273 -
 274
274 -
 275
275 -
 276
276 -
 277
277 -
 278
278 -
 279
279 -
 280
280 -
 281
281 -
 282
282 -
 283
283 -
 284
284 -
 285
285 -
 286
286 -
 287
287 -
 288
288 -
 289
289 -
 290
290 -
 291
291 -
 292
292 -
 293
293 -
 294
294 -
 295
295 -
 296
296
 |
 |

As of December 31, 2011, we had recognized cumulative net charges in Devices & Services of
EUR 797 million related to restructuring activities in 2011, which included restructuring charges and
associated impairments. While the total extent of the restructuring activities is still to be determined, we
currently anticipate cumulative charges in Devices & Services of around EUR 900 million before the
end of 2012. We also believe total cash outflows related to our Devices & Services restructuring
activities will be below the level of the cumulative charges related to these restructuring activities.
Operating Margin
Devices & Services operating profit decreased 75% to EUR 884 million in 2011, compared with
EUR 3 540 million in 2010. Devices & Services operating margin in 2011 was 3.7%, compared with
12.2% in 2010. The year-on-year decrease in operating margin in 2010 was driven primarily by the
lower net sales and gross margin compared to 2010 in both Smart Devices and Mobile Phones as well
as higher restructuring charges and Accenture transaction related consideration.
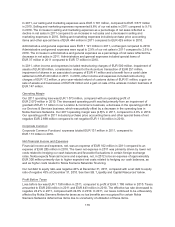
Smart Devices
The following table sets forth selective line items for Smart Devices for the fiscal years 2011 and 2010.
Year Ended
December 31,
2011
Change
2010 to 2011
Year Ended
December 31,
2010
Net sales (EUR millions)(1) ........... 10820 (27)% 14 874
Smart Devices volume (millions
units) ........................... 77.3 (25)% 103.6
Smart Devices ASP (EUR) ........... 140 (3)% 144
Gross margin (%) ................... 23.7% 30.8%
Operating expenses (EUR millions) .... 2974 (12)% 3 392
Contribution margin (%) ............. (3.8)% 9.3%
(1) Does not include IPR royalty income. IPR royalty income is recognized in Devices & Services
Other net sales.
Net Sales
Smart Devices net sales decreased 27% to EUR 10 820 million in 2011, compared to
EUR 14 874 million in 2010. The year-on-year decline in our Smart Devices net sales in 2011 was
primarily due to significantly lower volumes and, to a lesser extent, lower ASPs.
Volume
Smart Devices volume decreased 25% to 77.3 million units in 2011, compared to 103.6 million units in
2010. The year-on-year decrease in our Smart Device volumes in 2011 was driven by the strong
momentum of competing smartphone platforms relative to our higher priced Symbian devices,
particularly in Europe and Asia Pacific, as well as pricing tactics by certain of our competitors. During
the second quarter of 2011, our Smart Device volumes were also negatively affected by distributors
and operators purchasing fewer of our smartphones as they reduced their inventories of those devices,
which were slightly above normal levels at the end of the first quarter of 2011, particularly in China.
During the second half of 2011, our Symbian competitiveness continued to be challenged across the
portfolio driving the significant year-on-year volume decline.
120
