Nokia 2011 Annual Report Download - page 126
Download and view the complete annual report
Please find page 126 of the 2011 Nokia annual report below. You can navigate through the pages in the report by either clicking on the pages listed below, or by using the keyword search tool below to find specific information within the annual report.-
 1
1 -
2
-
3
-
4
-
5
-
6
-
7
-
8
-
9
-
10
-
11
-
12
-
13
-
14
-
15
-
16
-
17
-
18
-
19
-
20
-
21
-
22
-
23
-
24
-
25
-
26
-
27
-
28
-
29
-
30
-
31
-
32
-
33
-
34
-
35
-
36
-
37
-
38
-
39
-
40
-
41
-
42
-
43
-
44
-
45
-
46
-
47
-
48
-
49
-
50
-
51
-
52
-
53
-
54
-
55
-
56
-
57
-
58
-
59
-
60
-
61
-
62
-
63
-
64
-
65
-
66
-
67
-
68
-
69
-
70
-
71
-
72
-
73
-
74
-
75
-
76
-
77
-
78
-
79
-
80
-
81
-
82
-
83
-
84
-
85
-
86
-
87
-
88
-
89
-
90
-
91
-
92
-
93
-
94
-
95
-
96
-
97
-
98
-
99
-
100
-
101
-
102
-
103
-
104
-
105
-
106
-
107
-
108
-
109
-
110
-
111
-
112
-
113
-
114
-
115
-
 116
116 -
 117
117 -
 118
118 -
 119
119 -
 120
120 -
 121
121 -
 122
122 -
 123
123 -
 124
124 -
 125
125 -
 126
126 -
 127
127 -
 128
128 -
 129
129 -
 130
130 -
 131
131 -
 132
132 -
 133
133 -
 134
134 -
 135
135 -
 136
136 -
137
-
138
-
139
-
140
-
141
-
142
-
143
-
144
-
145
-
146
-
147
-
148
-
149
-
150
-
151
-
152
-
153
-
154
-
155
-
156
-
157
-
158
-
159
-
160
-
161
-
162
-
163
-
164
-
165
-
166
-
167
-
168
-
169
-
170
-
171
-
172
-
173
-
174
-
175
-
176
-
177
-
178
-
179
-
180
-
181
-
182
-
183
-
184
-
185
-
186
-
187
-
188
-
189
-
190
-
191
-
192
-
193
-
194
-
195
-
196
-
197
-
198
-
199
-
200
-
201
-
202
-
203
-
204
-
205
-
206
-
207
-
208
-
209
-
210
-
211
-
212
-
213
-
214
-
215
-
216
-
217
-
218
-
219
-
220
-
221
-
222
-
223
-
224
-
225
-
226
-
227
-
228
-
229
-
230
-
231
-
232
-
233
-
234
-
235
-
236
-
237
-
238
-
239
-
240
-
241
-
242
-
243
-
244
-
245
-
246
-
247
-
248
-
249
-
250
-
251
-
252
-
253
-
254
-
255
-
256
-
257
-
258
-
259
-
260
-
261
-
262
-
263
-
264
-
265
-
266
-
267
-
268
-
269
-
270
-
271
-
272
-
273
-
274
-
275
-
276
-
277
-
278
-
279
-
280
-
281
-
282
-
283
-
284
-
285
-
286
-
287
-
288
-
289
-
290
-
291
-
292
-
293
-
294
-
295
-
296
 |
 |

In the fourth quarter of 2011, we conducted our annual impairment testing to assess if events or
changes in circumstances indicated that the carrying amount of our goodwill may not be recoverable.
As a result, we recorded the above-noted impairment of goodwill in our Location & Commerce
business.
The impairment charge was the result of an evaluation of the projected financial performance of our
Location & Commerce business. This took into consideration the market dynamics in digital map data
and related location-based content markets, including our estimate of the market moving long-term
from fee-based towards advertising-based models especially in some more mature markets. It also
reflected recently announced results and related competitive factors in the local search and advertising
market resulting in lower estimated growth prospects from our location-based assets integrated with
different advertising platforms. After consideration of all relevant factors, we reduced the net sales
projections for Location & Commerce which, in turn, reduced projected profitability and cash flows.
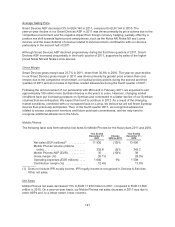
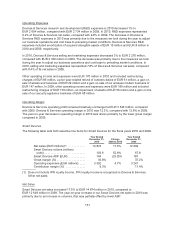
Nokia Siemens Networks
Nokia Siemens Networks completed the acquisition of the majority of Motorola Solutions’ wireless
network infrastructure assets on April 30, 2011. Accordingly, the results of Nokia Siemens Networks for
2011 are not directly comparable to 2010.
The following table sets forth selective line items and the percentage of net sales that they represent
for Nokia Siemens Networks for the fiscal years 2011 and 2010.
Year Ended
December 31,
2011
Percentage of
Net Sales
Year Ended
December 31,
2010
Percentage of
Net Sales
Percentage
Increase/
(Decrease)
(EUR millions, except percentage data)
Net sales ........................ 14041 100.0% 12 661 100.0% 11%
Cost of Sales ..................... (10239) (72.9)% (9 266) (73.2)% 11%
Gross profit ...................... 3802 27.1% 3 395 26.8% 12%
Research and development
expenses ...................... (2213) (15.8)% (2 156) (17.0)% 3%
Selling and marketing expenses ..... (1350) (9.6)% (1 328) (10.5)% 2%
Administrative and general
expenses ...................... (553) (3.9)% (553) (4.4)% 0%
Other income and expenses ......... 14 (0.1)% (44) (0.3)%
Operating profit ................... (300) (2.1)% (686) (5.4)% (56)%
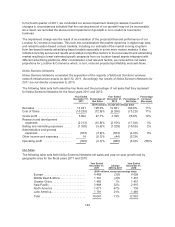
Net Sales
The following table sets forth Nokia Siemens Networks net sales and year-on-year growth rate by
geographic area for the fiscal years 2011 and 2010.
Year Ended
December 31,
2011
Change
2010 to 2011
Year Ended
December 31,
2010
(EUR millions, except percentage data)
Europe ........................... 4469 (3)% 4 628
Middle East & Africa ................ 1391 (4)% 1 451
Greater China ...................... 1465 1% 1451
Asia-Pacific ........................ 3848 32% 2915
North America ..................... 1077 47% 735
Latin America ...................... 1791 21% 1481
Total ............................. 14041 11% 12661
124