Nokia 2011 Annual Report Download - page 119
Download and view the complete annual report
Please find page 119 of the 2011 Nokia annual report below. You can navigate through the pages in the report by either clicking on the pages listed below, or by using the keyword search tool below to find specific information within the annual report.-
 1
1 -
2
-
3
-
4
-
5
-
6
-
7
-
8
-
9
-
10
-
11
-
12
-
13
-
14
-
15
-
16
-
17
-
18
-
19
-
20
-
21
-
22
-
23
-
24
-
25
-
26
-
27
-
28
-
29
-
30
-
31
-
32
-
33
-
34
-
35
-
36
-
37
-
38
-
39
-
40
-
41
-
42
-
43
-
44
-
45
-
46
-
47
-
48
-
49
-
50
-
51
-
52
-
53
-
54
-
55
-
56
-
57
-
58
-
59
-
60
-
61
-
62
-
63
-
64
-
65
-
66
-
67
-
68
-
69
-
70
-
71
-
72
-
73
-
74
-
75
-
76
-
77
-
78
-
79
-
80
-
81
-
82
-
83
-
84
-
85
-
86
-
87
-
88
-
89
-
90
-
91
-
92
-
93
-
94
-
95
-
96
-
97
-
98
-
99
-
100
-
101
-
102
-
103
-
104
-
105
-
106
-
107
-
108
-
 109
109 -
 110
110 -
 111
111 -
 112
112 -
 113
113 -
 114
114 -
 115
115 -
 116
116 -
 117
117 -
 118
118 -
 119
119 -
 120
120 -
 121
121 -
 122
122 -
 123
123 -
 124
124 -
 125
125 -
 126
126 -
 127
127 -
 128
128 -
 129
129 -
130
-
131
-
132
-
133
-
134
-
135
-
136
-
137
-
138
-
139
-
140
-
141
-
142
-
143
-
144
-
145
-
146
-
147
-
148
-
149
-
150
-
151
-
152
-
153
-
154
-
155
-
156
-
157
-
158
-
159
-
160
-
161
-
162
-
163
-
164
-
165
-
166
-
167
-
168
-
169
-
170
-
171
-
172
-
173
-
174
-
175
-
176
-
177
-
178
-
179
-
180
-
181
-
182
-
183
-
184
-
185
-
186
-
187
-
188
-
189
-
190
-
191
-
192
-
193
-
194
-
195
-
196
-
197
-
198
-
199
-
200
-
201
-
202
-
203
-
204
-
205
-
206
-
207
-
208
-
209
-
210
-
211
-
212
-
213
-
214
-
215
-
216
-
217
-
218
-
219
-
220
-
221
-
222
-
223
-
224
-
225
-
226
-
227
-
228
-
229
-
230
-
231
-
232
-
233
-
234
-
235
-
236
-
237
-
238
-
239
-
240
-
241
-
242
-
243
-
244
-
245
-
246
-
247
-
248
-
249
-
250
-
251
-
252
-
253
-
254
-
255
-
256
-
257
-
258
-
259
-
260
-
261
-
262
-
263
-
264
-
265
-
266
-
267
-
268
-
269
-
270
-
271
-
272
-
273
-
274
-
275
-
276
-
277
-
278
-
279
-
280
-
281
-
282
-
283
-
284
-
285
-
286
-
287
-
288
-
289
-
290
-
291
-
292
-
293
-
294
-
295
-
296
 |
 |

Non-controlling interests
Loss attributable to non-controlling interests totaled EUR 324 million in 2011, compared with loss
attributable to non-controlling interests of EUR 507 million in 2010. This change was primarily due to a
decrease in Nokia Siemens Networks’ losses.
Profit Attributable to Equity Holders of the Parent and Earnings per Share
Loss attributable to equity holders of the parent in 2011 totaled EUR 1 164 million, compared with profit
of EUR 1 850 million in 2010. Earnings per share in 2011 decreased to EUR (0.31) (basic) and
EUR (0.31) (diluted), compared with EUR 0.50 (basic) and EUR 0.50 (diluted) in 2010.
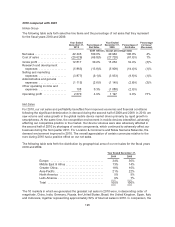
Results by Segments
Devices & Services
The following table sets forth selective line items and the percentage of net sales that they represent
for Devices & Services for the fiscal years 2011 and 2010.
Year Ended
December 31,
2011
Percentage of
Net Sales
Year Ended
December 31,
2010
Percentage of
Net Sales
Percentage
Increase/
(Decrease)
(EUR millions, except percentage data)
Net sales(1) ....................... 23943 100.0% 29 134 100.0% (18)%
Cost of sales ..................... (17303) (72.3)% (20 412) (70.1)% (15)%
Gross profit ...................... 6640 27.7% 8 722 29.9% (24)%
Research and development
expenses ...................... (2441) (10.2)% (2 694) (9.2)% (9)%
Selling and marketing expenses ..... (2180) (9.1)% (2 270) (7.8)% (4)%
Administrative and general
expenses ...................... (362) (1.5)% (388) (1.3)% (7)%
Other operating income and
expenses ...................... (773) (3.2)% 170 0.6%
Operating profit ................... 884 3.7% 3 540 12.2% (75)%
(1) Includes IPR royalty income recognized in Devices & Services Other net sales.
Net Sales
The following table sets forth our Devices & Services net sales and year-on-year growth rate by
geographic area for the fiscal years 2011 and 2010.
Year Ended
December 31,
2011
Change
2010 to 2011
Year Ended
December 31,
2010
(EUR millions, except percentage data)
Europe ........................... 7064 (27)% 9 736
Middle East & Africa ................ 4098 1% 4046
Greater China ...................... 5063 (18)% 6 167
Asia-Pacific ........................ 4896 (19)% 6 014
North America ..................... 354 (61)% 901
Latin America ...................... 2468 9% 2270
Total ............................. 23943 (18)% 29 134
117