Nokia 2011 Annual Report Download - page 215
Download and view the complete annual report
Please find page 215 of the 2011 Nokia annual report below. You can navigate through the pages in the report by either clicking on the pages listed below, or by using the keyword search tool below to find specific information within the annual report.-
 1
1 -
2
-
3
-
4
-
5
-
6
-
7
-
8
-
9
-
10
-
11
-
12
-
13
-
14
-
15
-
16
-
17
-
18
-
19
-
20
-
21
-
22
-
23
-
24
-
25
-
26
-
27
-
28
-
29
-
30
-
31
-
32
-
33
-
34
-
35
-
36
-
37
-
38
-
39
-
40
-
41
-
42
-
43
-
44
-
45
-
46
-
47
-
48
-
49
-
50
-
51
-
52
-
53
-
54
-
55
-
56
-
57
-
58
-
59
-
60
-
61
-
62
-
63
-
64
-
65
-
66
-
67
-
68
-
69
-
70
-
71
-
72
-
73
-
74
-
75
-
76
-
77
-
78
-
79
-
80
-
81
-
82
-
83
-
84
-
85
-
86
-
87
-
88
-
89
-
90
-
91
-
92
-
93
-
94
-
95
-
96
-
97
-
98
-
99
-
100
-
101
-
102
-
103
-
104
-
105
-
106
-
107
-
108
-
109
-
110
-
111
-
112
-
113
-
114
-
115
-
116
-
117
-
118
-
119
-
120
-
121
-
122
-
123
-
124
-
125
-
126
-
127
-
128
-
129
-
130
-
131
-
132
-
133
-
134
-
135
-
136
-
137
-
138
-
139
-
140
-
141
-
142
-
143
-
144
-
145
-
146
-
147
-
148
-
149
-
150
-
151
-
152
-
153
-
154
-
155
-
156
-
157
-
158
-
159
-
160
-
161
-
162
-
163
-
164
-
165
-
166
-
167
-
168
-
169
-
170
-
171
-
172
-
173
-
174
-
175
-
176
-
177
-
178
-
179
-
180
-
181
-
182
-
183
-
184
-
185
-
186
-
187
-
188
-
189
-
190
-
191
-
192
-
193
-
194
-
195
-
196
-
197
-
198
-
199
-
200
-
201
-
202
-
203
-
204
-
 205
205 -
 206
206 -
 207
207 -
 208
208 -
 209
209 -
 210
210 -
 211
211 -
 212
212 -
 213
213 -
 214
214 -
 215
215 -
 216
216 -
 217
217 -
 218
218 -
 219
219 -
 220
220 -
 221
221 -
 222
222 -
 223
223 -
 224
224 -
 225
225 -
226
-
227
-
228
-
229
-
230
-
231
-
232
-
233
-
234
-
235
-
236
-
237
-
238
-
239
-
240
-
241
-
242
-
243
-
244
-
245
-
246
-
247
-
248
-
249
-
250
-
251
-
252
-
253
-
254
-
255
-
256
-
257
-
258
-
259
-
260
-
261
-
262
-
263
-
264
-
265
-
266
-
267
-
268
-
269
-
270
-
271
-
272
-
273
-
274
-
275
-
276
-
277
-
278
-
279
-
280
-
281
-
282
-
283
-
284
-
285
-
286
-
287
-
288
-
289
-
290
-
291
-
292
-
293
-
294
-
295
-
296
 |
 |

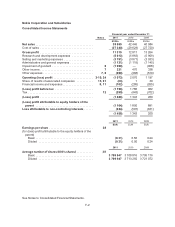
Nokia Corporation and Subsidiaries
Consolidated Statements of Cash Flows
Notes
Financial year ended December 31
2011 2010 2009
EURm EURm EURm
Cash flow from operating activities
(Loss) profit attributable to equity holders of the parent . . . ...... (1 164) 1 850 891
Adjustments, total .................................... 32 3 486 2 112 3 390
Change in net working capital .......................... 32 (638) 2 349 140
Cash generated from operations ........................... 1 684 6 311 4 421
Interest received ..................................... 190 110 125
Interest paid ........................................ (283) (235) (256)
Other financial income and expenses, net ................ 264 (507) (128)
Income taxes paid, net ................................ (718) (905) (915)
Net cash from operating activities ........................ 1 137 4 774 3 247
Cash flow from investing activities
Acquisition of Group companies, net of acquired cash . . . ...... (817) (110) (29)
Purchase of current available-for-sale investments, liquid
assets ............................................... (3 676) (8 573) (2 800)
Purchase of investments at fair value through profit and loss,
liquid assets .......................................... (607) (646) (695)
Purchase of non-current available-for-sale investments . . ...... (111) (124) (95)
Purchase of shares in associated companies ................. (2) (33) (30)
Additions to capitalized development costs ................... —— (27)
Proceeds from (+) / payment of (-) other long-term receivables . . (14) 22
Proceeds from (+) / payment of (-) short-term loans receivable . . (31) (2) 2
Capital expenditures ..................................... (597) (679) (531)
Proceeds from disposal of shares in Group companies, net of
disposed cash ........................................ (5) (21) —
Proceeds from disposal of shares in associated companies . . . . . 4540
Proceeds from disposal of businesses ...................... 3141 61
Proceeds from maturities and sale of current available-for-sale
investments, liquid assets ............................... 6 090 7 181 1 730
Proceeds from maturities and sale of investments at fair value
through profit and loss, liquid assets ...................... 1 156 333 108
Proceeds from sale of non-current available-for-sale
investments .......................................... 57 83 14
Proceeds from sale of fixed assets ......................... 48 21 100
Dividends received ...................................... 112
Net cash from / used in investing activities ................ 1 499 (2 421) (2 148)
Cash flow from financing activities
Other contributions from shareholders ....................... 546 ——
Purchase of treasury shares ............................... —1—
Proceeds from long-term borrowings ........................ 1482 3 901
Repayment of long-term borrowings ........................ (51) (6) (209)
Proceeds from (+) / repayment of (-) short-term borrowings . . . . . (59) 131 (2 842)
Dividends paid .......................................... (1 536) (1 519) (1 546)
Net cash used in financing activities ...................... (1 099) (911) (696)
Foreign exchange adjustment ........................... 107 224 (25)
Net increase (+) / decrease (-) in cash and cash
equivalents .......................................... 1 644 1 666 378
Cash and cash equivalents at beginning of period .......... 7 592 5 926 5 548
Cash and cash equivalents at end of period ............... 9 236 7 592 5 926
F-5