Nokia 2011 Annual Report Download - page 237
Download and view the complete annual report
Please find page 237 of the 2011 Nokia annual report below. You can navigate through the pages in the report by either clicking on the pages listed below, or by using the keyword search tool below to find specific information within the annual report.-
 1
1 -
2
-
3
-
4
-
5
-
6
-
7
-
8
-
9
-
10
-
11
-
12
-
13
-
14
-
15
-
16
-
17
-
18
-
19
-
20
-
21
-
22
-
23
-
24
-
25
-
26
-
27
-
28
-
29
-
30
-
31
-
32
-
33
-
34
-
35
-
36
-
37
-
38
-
39
-
40
-
41
-
42
-
43
-
44
-
45
-
46
-
47
-
48
-
49
-
50
-
51
-
52
-
53
-
54
-
55
-
56
-
57
-
58
-
59
-
60
-
61
-
62
-
63
-
64
-
65
-
66
-
67
-
68
-
69
-
70
-
71
-
72
-
73
-
74
-
75
-
76
-
77
-
78
-
79
-
80
-
81
-
82
-
83
-
84
-
85
-
86
-
87
-
88
-
89
-
90
-
91
-
92
-
93
-
94
-
95
-
96
-
97
-
98
-
99
-
100
-
101
-
102
-
103
-
104
-
105
-
106
-
107
-
108
-
109
-
110
-
111
-
112
-
113
-
114
-
115
-
116
-
117
-
118
-
119
-
120
-
121
-
122
-
123
-
124
-
125
-
126
-
127
-
128
-
129
-
130
-
131
-
132
-
133
-
134
-
135
-
136
-
137
-
138
-
139
-
140
-
141
-
142
-
143
-
144
-
145
-
146
-
147
-
148
-
149
-
150
-
151
-
152
-
153
-
154
-
155
-
156
-
157
-
158
-
159
-
160
-
161
-
162
-
163
-
164
-
165
-
166
-
167
-
168
-
169
-
170
-
171
-
172
-
173
-
174
-
175
-
176
-
177
-
178
-
179
-
180
-
181
-
182
-
183
-
184
-
185
-
186
-
187
-
188
-
189
-
190
-
191
-
192
-
193
-
194
-
195
-
196
-
197
-
198
-
199
-
200
-
201
-
202
-
203
-
204
-
205
-
206
-
207
-
208
-
209
-
210
-
211
-
212
-
213
-
214
-
215
-
216
-
217
-
218
-
219
-
220
-
221
-
222
-
223
-
224
-
225
-
226
-
 227
227 -
 228
228 -
 229
229 -
 230
230 -
 231
231 -
 232
232 -
 233
233 -
 234
234 -
 235
235 -
 236
236 -
 237
237 -
 238
238 -
 239
239 -
 240
240 -
 241
241 -
 242
242 -
 243
243 -
 244
244 -
 245
245 -
 246
246 -
 247
247 -
248
-
249
-
250
-
251
-
252
-
253
-
254
-
255
-
256
-
257
-
258
-
259
-
260
-
261
-
262
-
263
-
264
-
265
-
266
-
267
-
268
-
269
-
270
-
271
-
272
-
273
-
274
-
275
-
276
-
277
-
278
-
279
-
280
-
281
-
282
-
283
-
284
-
285
-
286
-
287
-
288
-
289
-
290
-
291
-
292
-
293
-
294
-
295
-
296
 |
 |

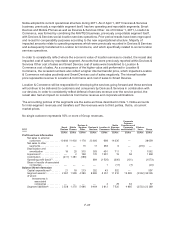
Nokia adopted its current operational structure during 2011. As of April 1, 2011 Devices & Services
business, previously a reportable segment itself, has two operating and reportable segments; Smart
Devices and Mobile Phones as well as Devices & Services Other. As of October 1, 2011, Location &
Commerce, was formed by combining the NAVTEQ business, previously a reportable segment itself,
with Devices & Services social location services operations. Prior period results have been regrouped
and recast for comparability purposes according to the new organizational structure. Majority of
impacted amounts relate to operating expenses which were previously recorded in Devices & Services
and subsequently transferred to Location & Commerce, and which specifically related to social location
services operations.
In order to consistently reflect where the economic value of location services is created, the recast also
impacted cost of sales by reportable segment. Amounts that were previously reported within Devices &
Services Other cost of sales and Smart Devices cost of sales were transferred to Location &
Commerce cost of sales. As a consequence of the higher value add performed in Location &
Commerce, the recasted numbers also reflect a higher internal transfer price, which impacted Location
& Commerce net sales positively and Smart Devices cost of sales negatively. The internal transfer
price represents revenue to Location & Commerce and cost of sales to Smart Devices.
Location & Commerce will be responsible for developing the services going forward and these services
will continue to be delivered to customers and consumers by Devices & Services in combination with
our devices. In order to consistently reflect deferral of services revenue over the service period, the
recast also had an impact on Location & Commerce revenue and corporate eliminations.
The accounting policies of the segments are the same as those described in Note 1. Nokia accounts
for inter-segment revenues and transfers as if the revenues were to third parties, that is, at current
market prices.
No single customer represents 10% or more of Group revenues.
2011
Smart
Devices
Mobile
Phones
Devices &
Services
Other
Devices &
Services
Location &
Commerce
Nokia
Siemens
Networks
Corporate
Common
Functions and
Corporate
unallocated(4)(6)
Elimina-
tions Group
EURm EURm EURm EURm EURm EURm EURm EURm EURm
Profit and Loss Information
Net sales to external
customers .............. 10818 11930 1178 23926 698 14035 — 38659
Net sales to other
segments ............... 2 — 15 17 393 6 — (416) —
Depreciation and
amortization ............ 18 20 315 353 491 711 7 1562
Impairment(1) .............. — 2 168 170 1091 19 58 1338
Contribution .............. (411) 1 481 (186)
Operating profit (loss)(1) ..... 884 (1526) (300) (131) (1 073)
Share of results of associated
companies .............. — — — — 1 (17) (7) (23)
Balance Sheet Information
Capital expenditures(2) ...... 21 18 213 252 43 302 — 597
Segment assets(3) .......... 2367 1999 4299 8665 5257 11310 13505 (2532)36205
of which:
Investments in
associated
companies .......... — — — — 4 29 34 67
Segment liabilities(5) ........ 2528 1270 5696 9494 2812 7520 4995 (2532)22289
F-27