Nokia 2011 Annual Report Download - page 138
Download and view the complete annual report
Please find page 138 of the 2011 Nokia annual report below. You can navigate through the pages in the report by either clicking on the pages listed below, or by using the keyword search tool below to find specific information within the annual report.-
 1
1 -
2
-
3
-
4
-
5
-
6
-
7
-
8
-
9
-
10
-
11
-
12
-
13
-
14
-
15
-
16
-
17
-
18
-
19
-
20
-
21
-
22
-
23
-
24
-
25
-
26
-
27
-
28
-
29
-
30
-
31
-
32
-
33
-
34
-
35
-
36
-
37
-
38
-
39
-
40
-
41
-
42
-
43
-
44
-
45
-
46
-
47
-
48
-
49
-
50
-
51
-
52
-
53
-
54
-
55
-
56
-
57
-
58
-
59
-
60
-
61
-
62
-
63
-
64
-
65
-
66
-
67
-
68
-
69
-
70
-
71
-
72
-
73
-
74
-
75
-
76
-
77
-
78
-
79
-
80
-
81
-
82
-
83
-
84
-
85
-
86
-
87
-
88
-
89
-
90
-
91
-
92
-
93
-
94
-
95
-
96
-
97
-
98
-
99
-
100
-
101
-
102
-
103
-
104
-
105
-
106
-
107
-
108
-
109
-
110
-
111
-
112
-
113
-
114
-
115
-
116
-
117
-
118
-
119
-
120
-
121
-
122
-
123
-
124
-
125
-
126
-
127
-
 128
128 -
 129
129 -
 130
130 -
 131
131 -
 132
132 -
 133
133 -
 134
134 -
 135
135 -
 136
136 -
 137
137 -
 138
138 -
 139
139 -
 140
140 -
 141
141 -
 142
142 -
 143
143 -
 144
144 -
 145
145 -
 146
146 -
 147
147 -
 148
148 -
149
-
150
-
151
-
152
-
153
-
154
-
155
-
156
-
157
-
158
-
159
-
160
-
161
-
162
-
163
-
164
-
165
-
166
-
167
-
168
-
169
-
170
-
171
-
172
-
173
-
174
-
175
-
176
-
177
-
178
-
179
-
180
-
181
-
182
-
183
-
184
-
185
-
186
-
187
-
188
-
189
-
190
-
191
-
192
-
193
-
194
-
195
-
196
-
197
-
198
-
199
-
200
-
201
-
202
-
203
-
204
-
205
-
206
-
207
-
208
-
209
-
210
-
211
-
212
-
213
-
214
-
215
-
216
-
217
-
218
-
219
-
220
-
221
-
222
-
223
-
224
-
225
-
226
-
227
-
228
-
229
-
230
-
231
-
232
-
233
-
234
-
235
-
236
-
237
-
238
-
239
-
240
-
241
-
242
-
243
-
244
-
245
-
246
-
247
-
248
-
249
-
250
-
251
-
252
-
253
-
254
-
255
-
256
-
257
-
258
-
259
-
260
-
261
-
262
-
263
-
264
-
265
-
266
-
267
-
268
-
269
-
270
-
271
-
272
-
273
-
274
-
275
-
276
-
277
-
278
-
279
-
280
-
281
-
282
-
283
-
284
-
285
-
286
-
287
-
288
-
289
-
290
-
291
-
292
-
293
-
294
-
295
-
296
 |
 |

Operating Expenses
In Nokia Siemens Networks, R&D expenses decreased to EUR 2 156 million in 2010, compared with
EUR 2 271 million in 2009. In 2010, R&D expenses represented 17.0% of Nokia Siemens Networks
net sales, compared with 18.1% in 2009. The decrease in R&D expenses resulted largely from a
higher proportion of R&D activities being conducted in emerging markets. In 2010, R&D expenses
included restructuring charges and other items of EUR 19 million (EUR 30 million in 2009) and
purchase price accounting related items of EUR 180 million (EUR 180 million in 2009).
In 2010, Nokia Siemens Networks’ selling and marketing expenses decreased to EUR 1 328 million,
compared with EUR 1 349 million in 2009. Nokia Siemens Networks’ selling and marketing expenses
represented 10.5% of its net sales in 2009, compared to 10.7% in 2009. The slight reduction in selling
and marketing expenses was related to ongoing restructuring and measures to reduce discretionary
expenditure. In 2010, selling and marketing expenses included restructuring charges of EUR 21 million
(EUR 12 million in 2009) and purchase price accounting related items of EUR 285 million
(EUR 286 million in 2009).
In 2010, other operating expenses of EUR 44 million included restructuring charges of EUR 27 million.
In 2009, other operating income and expenses included an impairment of goodwill of EUR 908 million
in the third quarter of 2009 due to a decline in forecasted profits and cash flows as a result of
challenging competitive factors and market conditions in the infrastructure and related service
business. In addition, other operating income and expenses in 2009 included a restructuring charge
and other items of EUR 14 million, purchase price accounting related items of EUR 5 million and a gain
of EUR 22 million on the sale of real estate.
Operating Margin
Nokia Siemens Networks had an operating loss of EUR 686 million in 2010, compared with an
operating loss of EUR 1 639 million in 2009. The operating margin of Nokia Siemens Networks in 2010
was negative 5.4% compared with negative 13.0% in 2009. The operating loss decrease in 2010
resulted primarily from the absence of goodwill charges in 2010, compared to the EUR 908 million
impairment of goodwill in 2009, higher net sales and lower operating expenses, the impact of which
was partially offset by the lower gross margin.
5B. Liquidity and Capital Resources
At December 31, 2011, our cash and other liquid assets (bank and cash; available-for-sale
investments, cash equivalents; available-for-sale investments, liquid assets; and investments at fair
value through profit and loss, liquid assets) decreased to EUR 10 902 million, compared with
EUR 12 275 million at December 31, 2010, primarily due to the payment of the dividend, cash outflows
related to the acquisition of Motorola Solutions’ networks assets and capital expenditures, partially
offset by positive overall net cash from operating activities and a EUR 500 million equity investment in
Nokia Siemens Networks by Siemens. At December 31, 2009, cash and other liquid assets totaled
EUR 8 873 million.
At December 31, 2011, cash and cash equivalents (bank and cash and available-for-sale investments,
cash equivalent) increased to EUR 9 236 million, compared with EUR 7 592 million at December 31,
2010. We hold our cash and cash equivalents predominantly in euro. Cash and cash equivalents
totaled EUR 5 926 million at December 31, 2009.
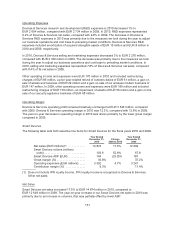
Net cash from operating activities was EUR 1 137 million in 2011, compared with EUR 4 774 million in
2010 and EUR 3 247 million in 2009. In 2011, net cash from operating activities decreased primarily
136