Nokia 2011 Annual Report Download - page 133
Download and view the complete annual report
Please find page 133 of the 2011 Nokia annual report below. You can navigate through the pages in the report by either clicking on the pages listed below, or by using the keyword search tool below to find specific information within the annual report.-
 1
1 -
2
-
3
-
4
-
5
-
6
-
7
-
8
-
9
-
10
-
11
-
12
-
13
-
14
-
15
-
16
-
17
-
18
-
19
-
20
-
21
-
22
-
23
-
24
-
25
-
26
-
27
-
28
-
29
-
30
-
31
-
32
-
33
-
34
-
35
-
36
-
37
-
38
-
39
-
40
-
41
-
42
-
43
-
44
-
45
-
46
-
47
-
48
-
49
-
50
-
51
-
52
-
53
-
54
-
55
-
56
-
57
-
58
-
59
-
60
-
61
-
62
-
63
-
64
-
65
-
66
-
67
-
68
-
69
-
70
-
71
-
72
-
73
-
74
-
75
-
76
-
77
-
78
-
79
-
80
-
81
-
82
-
83
-
84
-
85
-
86
-
87
-
88
-
89
-
90
-
91
-
92
-
93
-
94
-
95
-
96
-
97
-
98
-
99
-
100
-
101
-
102
-
103
-
104
-
105
-
106
-
107
-
108
-
109
-
110
-
111
-
112
-
113
-
114
-
115
-
116
-
117
-
118
-
119
-
120
-
121
-
122
-
 123
123 -
 124
124 -
 125
125 -
 126
126 -
 127
127 -
 128
128 -
 129
129 -
 130
130 -
 131
131 -
 132
132 -
 133
133 -
 134
134 -
 135
135 -
 136
136 -
 137
137 -
 138
138 -
 139
139 -
 140
140 -
 141
141 -
 142
142 -
 143
143 -
144
-
145
-
146
-
147
-
148
-
149
-
150
-
151
-
152
-
153
-
154
-
155
-
156
-
157
-
158
-
159
-
160
-
161
-
162
-
163
-
164
-
165
-
166
-
167
-
168
-
169
-
170
-
171
-
172
-
173
-
174
-
175
-
176
-
177
-
178
-
179
-
180
-
181
-
182
-
183
-
184
-
185
-
186
-
187
-
188
-
189
-
190
-
191
-
192
-
193
-
194
-
195
-
196
-
197
-
198
-
199
-
200
-
201
-
202
-
203
-
204
-
205
-
206
-
207
-
208
-
209
-
210
-
211
-
212
-
213
-
214
-
215
-
216
-
217
-
218
-
219
-
220
-
221
-
222
-
223
-
224
-
225
-
226
-
227
-
228
-
229
-
230
-
231
-
232
-
233
-
234
-
235
-
236
-
237
-
238
-
239
-
240
-
241
-
242
-
243
-
244
-
245
-
246
-
247
-
248
-
249
-
250
-
251
-
252
-
253
-
254
-
255
-
256
-
257
-
258
-
259
-
260
-
261
-
262
-
263
-
264
-
265
-
266
-
267
-
268
-
269
-
270
-
271
-
272
-
273
-
274
-
275
-
276
-
277
-
278
-
279
-
280
-
281
-
282
-
283
-
284
-
285
-
286
-
287
-
288
-
289
-
290
-
291
-
292
-
293
-
294
-
295
-
296
 |
 |

Operating Expenses
Devices & Services research and development (R&D) expenses in 2010 decreased 1% to
EUR 2 694 million, compared with EUR 2 734 million in 2009. In 2010, R&D expenses represented
9.2% of Devices & Services net sales, compared with 9.8% in 2009. The decrease in Devices &
Services R&D expenses in 2010 was primarily due to the measures we took during the year to adjust
our business operations and cost base to prevailing market conditions. Devices & Services R&D
expenses included amortization of acquired intangible assets of EUR 10 million and EUR 8 million in
2010 and 2009, respectively.
In 2010, Devices & Services selling and marketing expenses decreased 3% to EUR 2 270 million,
compared with EUR 2 330 million in 2009. The decrease was primarily due to the measures we took
during the year to adjust our business operations and cost base to prevailing market conditions. In
2010, selling and marketing expenses represented 7.8% of Devices & Services net sales, compared
with 8.4% of its net sales in 2009.
Other operating income and expenses were EUR 170 million in 2010 and included restructuring
charges of EUR 85 million, a prior year-related refund of customs duties of EUR 61 million, a gain on
sale of assets and business of EUR 29 million and a gain on sale of our wireless modem business of
EUR 147 million. In 2009, other operating income and expenses were EUR 189 million and included
restructuring charges of EUR 178 million, an impairment of assets of EUR 56 million and a gain on the
sale of our security appliance business of EUR 68 million.
Operating Margin
Devices & Services operating profit remained relatively unchanged at EUR 3 540 million, compared
with 2009. Devices & Services operating margin in 2010 was 12.2%, compared with 12.8% in 2009.
The year-on-year decrease in operating margin in 2010 was driven primarily by the lower gross margin
compared to 2009.
Smart Devices
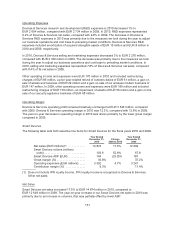
The following table sets forth selective line items for Smart Devices for the fiscal years 2010 and 2009.
Year Ended
December 31,
2010
Change
2009 to 2010
Year Ended
December 31,
2009
Net sales (EUR millions)(1) ........... 14874 17.6% 12 649
Smart Devices volume (millions
units) ........................... 103.6 52.8% 67.8
Smart Devices ASP (EUR) ........... 144 (23.0)% 187
Gross margin (%) ................... 30.8% 37.2%
Operating expenses (EUR millions) .... 3392 4.7% 3 241
Contribution margin (%) ............. 9.3% 11.4%
(1) Does not include IPR royalty income. IPR royalty income is recognized in Devices & Services
Other net sales.
Net Sales
Smart Devices net sales increased 17.6% to EUR 14 874 million in 2010, compared to
EUR 12 649 million in 2009. The year-on-year increase in our Smart Devices net sales in 2010 was
primarily due to an increase in volumes, that was partially offset by lower ASP.
131