Nokia 2011 Annual Report Download - page 268
Download and view the complete annual report
Please find page 268 of the 2011 Nokia annual report below. You can navigate through the pages in the report by either clicking on the pages listed below, or by using the keyword search tool below to find specific information within the annual report.-
 1
1 -
2
-
3
-
4
-
5
-
6
-
7
-
8
-
9
-
10
-
11
-
12
-
13
-
14
-
15
-
16
-
17
-
18
-
19
-
20
-
21
-
22
-
23
-
24
-
25
-
26
-
27
-
28
-
29
-
30
-
31
-
32
-
33
-
34
-
35
-
36
-
37
-
38
-
39
-
40
-
41
-
42
-
43
-
44
-
45
-
46
-
47
-
48
-
49
-
50
-
51
-
52
-
53
-
54
-
55
-
56
-
57
-
58
-
59
-
60
-
61
-
62
-
63
-
64
-
65
-
66
-
67
-
68
-
69
-
70
-
71
-
72
-
73
-
74
-
75
-
76
-
77
-
78
-
79
-
80
-
81
-
82
-
83
-
84
-
85
-
86
-
87
-
88
-
89
-
90
-
91
-
92
-
93
-
94
-
95
-
96
-
97
-
98
-
99
-
100
-
101
-
102
-
103
-
104
-
105
-
106
-
107
-
108
-
109
-
110
-
111
-
112
-
113
-
114
-
115
-
116
-
117
-
118
-
119
-
120
-
121
-
122
-
123
-
124
-
125
-
126
-
127
-
128
-
129
-
130
-
131
-
132
-
133
-
134
-
135
-
136
-
137
-
138
-
139
-
140
-
141
-
142
-
143
-
144
-
145
-
146
-
147
-
148
-
149
-
150
-
151
-
152
-
153
-
154
-
155
-
156
-
157
-
158
-
159
-
160
-
161
-
162
-
163
-
164
-
165
-
166
-
167
-
168
-
169
-
170
-
171
-
172
-
173
-
174
-
175
-
176
-
177
-
178
-
179
-
180
-
181
-
182
-
183
-
184
-
185
-
186
-
187
-
188
-
189
-
190
-
191
-
192
-
193
-
194
-
195
-
196
-
197
-
198
-
199
-
200
-
201
-
202
-
203
-
204
-
205
-
206
-
207
-
208
-
209
-
210
-
211
-
212
-
213
-
214
-
215
-
216
-
217
-
218
-
219
-
220
-
221
-
222
-
223
-
224
-
225
-
226
-
227
-
228
-
229
-
230
-
231
-
232
-
233
-
234
-
235
-
236
-
237
-
238
-
239
-
240
-
241
-
242
-
243
-
244
-
245
-
246
-
247
-
248
-
249
-
250
-
251
-
252
-
253
-
254
-
255
-
256
-
257
-
 258
258 -
 259
259 -
 260
260 -
 261
261 -
 262
262 -
 263
263 -
 264
264 -
 265
265 -
 266
266 -
 267
267 -
 268
268 -
 269
269 -
 270
270 -
 271
271 -
 272
272 -
 273
273 -
 274
274 -
 275
275 -
 276
276 -
 277
277 -
 278
278 -
279
-
280
-
281
-
282
-
283
-
284
-
285
-
286
-
287
-
288
-
289
-
290
-
291
-
292
-
293
-
294
-
295
-
296
 |
 |

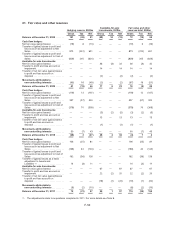
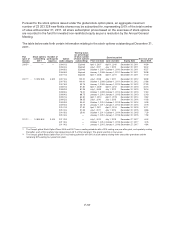
Total stock options outstanding at December 31, 2011(1)
Number of shares
Weighted average
exercise price
EUR
Weighted
average share
price EUR
Shares under option at January 1, 2009 ............ 23 813 865 15.89
Granted ........................................ 4791232 11.15
Exercised ....................................... 104172 6.18 9.52
Forfeited ....................................... 893943 17.01
Expired ........................................ 4567020 13.55
Shares under option at December 31, 2009 ......... 23 039 962 15.39
Granted ........................................ 6708582 8.73
Exercised ....................................... 39772 2.20 9.44
Forfeited ....................................... 1698435 12.07
Expired ........................................ 6065041 13.97
Shares under option at December 31, 2010 ........ 21 945 296 14.04
Granted ........................................ 11751907 5.50
Exercised ....................................... 6208 5.07 7.69
Forfeited ....................................... 2441876 9.05
Expired ........................................ 7909089 17.53
Shares under option at December 31, 2011 ........ 23 340 030 9.08
Options exercisable at December 31, 2008 (shares) .... 12895057 14.77
Options exercisable at December 31, 2009 (shares) .... 13124925 16.09
Options exercisable at December 31, 2010 (shares) .... 11376937 17.07
Options exercisable at December 31, 2011 (shares) .... 6 904 331 14.01
(1) Includes also stock options granted under other than global equity plans. For further information
see “Other equity plans for employees” below.
The weighted average grant date fair value of stock options granted was EUR 0.92 in 2011, EUR 2.29
in 2010 and EUR 2.34 in 2009.
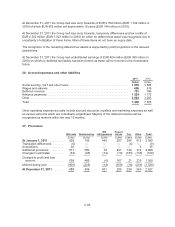
The options outstanding by range of exercise price at December 31, 2011 are as follows:
Options outstanding
Exercise prices EUR
Number of
shares
Weighted
average
remaining
contractual life
in years
Weighted average
exercise price
EUR
0.90-4.84 ....................................... 2825362 5.99 3.85
5.14-6.02 ....................................... 8098681 5.98 6.01
6.20-8.86 ....................................... 5112043 4.00 8.69
8.88-14.75 ...................................... 3994625 2.84 11.40
17.80-27.53 ..................................... 3309319 1.50 18.83
23 340 030
F-58