Nokia 2011 Annual Report Download - page 258
Download and view the complete annual report
Please find page 258 of the 2011 Nokia annual report below. You can navigate through the pages in the report by either clicking on the pages listed below, or by using the keyword search tool below to find specific information within the annual report.-
 1
1 -
2
-
3
-
4
-
5
-
6
-
7
-
8
-
9
-
10
-
11
-
12
-
13
-
14
-
15
-
16
-
17
-
18
-
19
-
20
-
21
-
22
-
23
-
24
-
25
-
26
-
27
-
28
-
29
-
30
-
31
-
32
-
33
-
34
-
35
-
36
-
37
-
38
-
39
-
40
-
41
-
42
-
43
-
44
-
45
-
46
-
47
-
48
-
49
-
50
-
51
-
52
-
53
-
54
-
55
-
56
-
57
-
58
-
59
-
60
-
61
-
62
-
63
-
64
-
65
-
66
-
67
-
68
-
69
-
70
-
71
-
72
-
73
-
74
-
75
-
76
-
77
-
78
-
79
-
80
-
81
-
82
-
83
-
84
-
85
-
86
-
87
-
88
-
89
-
90
-
91
-
92
-
93
-
94
-
95
-
96
-
97
-
98
-
99
-
100
-
101
-
102
-
103
-
104
-
105
-
106
-
107
-
108
-
109
-
110
-
111
-
112
-
113
-
114
-
115
-
116
-
117
-
118
-
119
-
120
-
121
-
122
-
123
-
124
-
125
-
126
-
127
-
128
-
129
-
130
-
131
-
132
-
133
-
134
-
135
-
136
-
137
-
138
-
139
-
140
-
141
-
142
-
143
-
144
-
145
-
146
-
147
-
148
-
149
-
150
-
151
-
152
-
153
-
154
-
155
-
156
-
157
-
158
-
159
-
160
-
161
-
162
-
163
-
164
-
165
-
166
-
167
-
168
-
169
-
170
-
171
-
172
-
173
-
174
-
175
-
176
-
177
-
178
-
179
-
180
-
181
-
182
-
183
-
184
-
185
-
186
-
187
-
188
-
189
-
190
-
191
-
192
-
193
-
194
-
195
-
196
-
197
-
198
-
199
-
200
-
201
-
202
-
203
-
204
-
205
-
206
-
207
-
208
-
209
-
210
-
211
-
212
-
213
-
214
-
215
-
216
-
217
-
218
-
219
-
220
-
221
-
222
-
223
-
224
-
225
-
226
-
227
-
228
-
229
-
230
-
231
-
232
-
233
-
234
-
235
-
236
-
237
-
238
-
239
-
240
-
241
-
242
-
243
-
244
-
245
-
246
-
247
-
 248
248 -
 249
249 -
 250
250 -
 251
251 -
 252
252 -
 253
253 -
 254
254 -
 255
255 -
 256
256 -
 257
257 -
 258
258 -
 259
259 -
 260
260 -
 261
261 -
 262
262 -
 263
263 -
 264
264 -
 265
265 -
 266
266 -
 267
267 -
 268
268 -
269
-
270
-
271
-
272
-
273
-
274
-
275
-
276
-
277
-
278
-
279
-
280
-
281
-
282
-
283
-
284
-
285
-
286
-
287
-
288
-
289
-
290
-
291
-
292
-
293
-
294
-
295
-
296
 |
 |

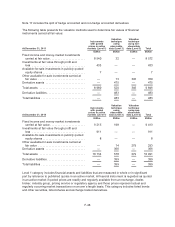
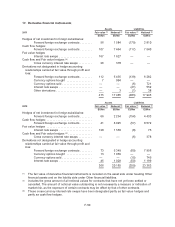
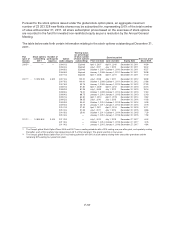
Note 17 includes the split of hedge accounted and non-hedge accounted derivatives.
The following table presents the valuation methods used to determine fair values of financial
instruments carried at fair value:
At December 31, 2011
Instruments
with quoted
prices in active
markets (Level 1)
Valuation
technique
using
observable
data (Level 2)
Valuation
technique
using non-
observable
data (Level 3) Total
EURm EURm EURm EURm
Fixed income and money-market investments
carried at fair value ....................... 8540 32 — 8572
Investments at fair value through profit and
loss ................................... 433 — — 433
Available-for-sale investments in publicly quoted
equity shares ............................ 7 — — 7
Other available-for-sale investments carried at
fair value ............................... — 13 346 359
Derivative assets .......................... — 475 — 475
Total assets .............................. 8980 520 346 9846
Derivative liabilities ......................... — 483 — 483
Total liabilities ............................. — 483 — 483
At December 31, 2010
Instruments
with quoted
prices in active
markets (Level 1)
Valuation
technique
using
observable
data (Level 2)
Valuation
technique
using non-
observable
data (Level 3) Total
EURm EURm EURm EURm
Fixed income and money-market investments
carried at fair value ....................... 9215 198 — 9413
Investments at fair value through profit and
loss ................................... 911 — — 911
Available-for-sale investments in publicly quoted
equity shares ............................ 8 — — 8
Other available-for-sale investments carried at
fair value ............................... — 14 279 293
Derivative assets .......................... — 366 — 366
Total assets .............................. 10134 578 279 10991
Derivative liabilities ......................... — 359 — 359
Total liabilities ............................. — 359 — 359
Level 1 category includes financial assets and liabilities that are measured in whole or in significant
part by reference to published quotes in an active market. A financial instrument is regarded as quoted
in an active market if quoted prices are readily and regularly available from an exchange, dealer,
broker, industry group, pricing service or regulatory agency and those prices represent actual and
regularly occurring market transactions on an arm’s length basis. This category includes listed bonds
and other securities, listed shares and exchange traded derivatives.
F-48