Nokia 2011 Annual Report Download - page 129
Download and view the complete annual report
Please find page 129 of the 2011 Nokia annual report below. You can navigate through the pages in the report by either clicking on the pages listed below, or by using the keyword search tool below to find specific information within the annual report.-
 1
1 -
2
-
3
-
4
-
5
-
6
-
7
-
8
-
9
-
10
-
11
-
12
-
13
-
14
-
15
-
16
-
17
-
18
-
19
-
20
-
21
-
22
-
23
-
24
-
25
-
26
-
27
-
28
-
29
-
30
-
31
-
32
-
33
-
34
-
35
-
36
-
37
-
38
-
39
-
40
-
41
-
42
-
43
-
44
-
45
-
46
-
47
-
48
-
49
-
50
-
51
-
52
-
53
-
54
-
55
-
56
-
57
-
58
-
59
-
60
-
61
-
62
-
63
-
64
-
65
-
66
-
67
-
68
-
69
-
70
-
71
-
72
-
73
-
74
-
75
-
76
-
77
-
78
-
79
-
80
-
81
-
82
-
83
-
84
-
85
-
86
-
87
-
88
-
89
-
90
-
91
-
92
-
93
-
94
-
95
-
96
-
97
-
98
-
99
-
100
-
101
-
102
-
103
-
104
-
105
-
106
-
107
-
108
-
109
-
110
-
111
-
112
-
113
-
114
-
115
-
116
-
117
-
118
-
 119
119 -
 120
120 -
 121
121 -
 122
122 -
 123
123 -
 124
124 -
 125
125 -
 126
126 -
 127
127 -
 128
128 -
 129
129 -
 130
130 -
 131
131 -
 132
132 -
 133
133 -
 134
134 -
 135
135 -
 136
136 -
 137
137 -
 138
138 -
 139
139 -
140
-
141
-
142
-
143
-
144
-
145
-
146
-
147
-
148
-
149
-
150
-
151
-
152
-
153
-
154
-
155
-
156
-
157
-
158
-
159
-
160
-
161
-
162
-
163
-
164
-
165
-
166
-
167
-
168
-
169
-
170
-
171
-
172
-
173
-
174
-
175
-
176
-
177
-
178
-
179
-
180
-
181
-
182
-
183
-
184
-
185
-
186
-
187
-
188
-
189
-
190
-
191
-
192
-
193
-
194
-
195
-
196
-
197
-
198
-
199
-
200
-
201
-
202
-
203
-
204
-
205
-
206
-
207
-
208
-
209
-
210
-
211
-
212
-
213
-
214
-
215
-
216
-
217
-
218
-
219
-
220
-
221
-
222
-
223
-
224
-
225
-
226
-
227
-
228
-
229
-
230
-
231
-
232
-
233
-
234
-
235
-
236
-
237
-
238
-
239
-
240
-
241
-
242
-
243
-
244
-
245
-
246
-
247
-
248
-
249
-
250
-
251
-
252
-
253
-
254
-
255
-
256
-
257
-
258
-
259
-
260
-
261
-
262
-
263
-
264
-
265
-
266
-
267
-
268
-
269
-
270
-
271
-
272
-
273
-
274
-
275
-
276
-
277
-
278
-
279
-
280
-
281
-
282
-
283
-
284
-
285
-
286
-
287
-
288
-
289
-
290
-
291
-
292
-
293
-
294
-
295
-
296
 |
 |

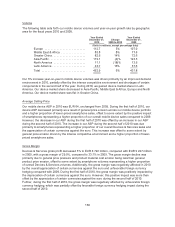
10 markets in which we generated the greatest net sales in 2009 were China, India, the
United Kingdom, Germany, the United States, Russia, Indonesia, Spain, Brazil and Italy, together
representing approximately 52% of total net sales in 2009.
Gross Margin
Our gross margin in 2010 was 30.2% compared with 32.4% in 2009. The lower gross margin in 2010
resulted primarily from the decrease in gross margin in all three of our reportable segments compared
to 2009.
Operating Expenses
Research and development (R&D) expenses were EUR 5 863 million in 2010, down 1% from
EUR 5 909 million in 2009. R&D costs represented 13.8% of our net sales in 2010, down from 14.4%
in 2009. The decrease in R&D expenses as a percentage of net sales primarily reflected the increase
in net sales in 2010. Research and development expenses included purchase price accounting items
and other special items of EUR 575 million in 2010, compared to EUR 564 million in 2009. At
December 31, 2010, we employed 35 869 people in research and development, representing
approximately 27% of the group’s total workforce, and had a strong research and development
presence in 16 countries.
In 2010, our selling and marketing expenses were EUR 3 877 million, down 1% from EUR 3 933 million
in 2009. Selling and marketing expenses represented 9.1% of our net sales in 2010, compared with
9.6% in 2009. The decrease in selling and marketing expenses as a percentage of net sales primarily
reflected the increase in net sales in 2010. Selling and marketing expenses included purchase price
accounting items and other special items of EUR 429 million in 2010, compared to EUR 413 million in
2009.
Administrative and general expenses were EUR 1 115 million in 2010, down 3% from EUR 1 145 in
2009. Administrative and general expenses represented 2.6% of our net sales in 2010, compared with
2.8% in 2009. The decrease in administrative and general expenses as a percentage of net sales
primarily reflected the increase in net sales in 2010. Administrative and general expenses included
special items of EUR 77 million in 2010, compared to EUR 103 million in 2009.
In 2010, other income and expenses included restructuring charges of EUR 112 million, a prior year-
related refund of customs duties of EUR 61 million, a gain on sale of assets and businesses of
EUR 29 million and a gain on sale of our wireless modem business of EUR 147 million. In 2009, other
income and expenses included restructuring charges of EUR 192 million, purchase price accounting
related items of EUR 5 million, an impairment of goodwill related to Nokia Siemens Networks of
EUR 908 million, an impairment of assets of EUR 56 million, a gain on sale of our security appliance
business of EUR 68 million and a gain on sale of real estate of EUR 22 million.
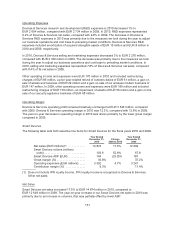
Operating Margin
Our operating profit for 2010 increased 73% to EUR 2 070 million, compared with EUR 1 197 million in
2009. The increased operating profit resulted primarily from a decrease in the operating losses at
Nokia Siemens Networks and Location & Commerce, which were partially offset by a lower operating
profit in Devices & Services. Our operating margin was 4.9% in 2010, compared with 2.9% in 2009.
Our operating profit in 2010 included purchase price accounting items and other special items of net
negative EUR 1 134 million, compared to net negative EUR 2 306 million in 2009.
127