Nokia 2011 Annual Report Download - page 193
Download and view the complete annual report
Please find page 193 of the 2011 Nokia annual report below. You can navigate through the pages in the report by either clicking on the pages listed below, or by using the keyword search tool below to find specific information within the annual report.-
 1
1 -
2
-
3
-
4
-
5
-
6
-
7
-
8
-
9
-
10
-
11
-
12
-
13
-
14
-
15
-
16
-
17
-
18
-
19
-
20
-
21
-
22
-
23
-
24
-
25
-
26
-
27
-
28
-
29
-
30
-
31
-
32
-
33
-
34
-
35
-
36
-
37
-
38
-
39
-
40
-
41
-
42
-
43
-
44
-
45
-
46
-
47
-
48
-
49
-
50
-
51
-
52
-
53
-
54
-
55
-
56
-
57
-
58
-
59
-
60
-
61
-
62
-
63
-
64
-
65
-
66
-
67
-
68
-
69
-
70
-
71
-
72
-
73
-
74
-
75
-
76
-
77
-
78
-
79
-
80
-
81
-
82
-
83
-
84
-
85
-
86
-
87
-
88
-
89
-
90
-
91
-
92
-
93
-
94
-
95
-
96
-
97
-
98
-
99
-
100
-
101
-
102
-
103
-
104
-
105
-
106
-
107
-
108
-
109
-
110
-
111
-
112
-
113
-
114
-
115
-
116
-
117
-
118
-
119
-
120
-
121
-
122
-
123
-
124
-
125
-
126
-
127
-
128
-
129
-
130
-
131
-
132
-
133
-
134
-
135
-
136
-
137
-
138
-
139
-
140
-
141
-
142
-
143
-
144
-
145
-
146
-
147
-
148
-
149
-
150
-
151
-
152
-
153
-
154
-
155
-
156
-
157
-
158
-
159
-
160
-
161
-
162
-
163
-
164
-
165
-
166
-
167
-
168
-
169
-
170
-
171
-
172
-
173
-
174
-
175
-
176
-
177
-
178
-
179
-
180
-
181
-
182
-
 183
183 -
 184
184 -
 185
185 -
 186
186 -
 187
187 -
 188
188 -
 189
189 -
 190
190 -
 191
191 -
 192
192 -
 193
193 -
 194
194 -
 195
195 -
 196
196 -
 197
197 -
 198
198 -
 199
199 -
 200
200 -
 201
201 -
 202
202 -
 203
203 -
204
-
205
-
206
-
207
-
208
-
209
-
210
-
211
-
212
-
213
-
214
-
215
-
216
-
217
-
218
-
219
-
220
-
221
-
222
-
223
-
224
-
225
-
226
-
227
-
228
-
229
-
230
-
231
-
232
-
233
-
234
-
235
-
236
-
237
-
238
-
239
-
240
-
241
-
242
-
243
-
244
-
245
-
246
-
247
-
248
-
249
-
250
-
251
-
252
-
253
-
254
-
255
-
256
-
257
-
258
-
259
-
260
-
261
-
262
-
263
-
264
-
265
-
266
-
267
-
268
-
269
-
270
-
271
-
272
-
273
-
274
-
275
-
276
-
277
-
278
-
279
-
280
-
281
-
282
-
283
-
284
-
285
-
286
-
287
-
288
-
289
-
290
-
291
-
292
-
293
-
294
-
295
-
296
 |
 |

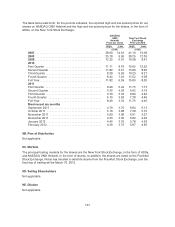
The table below sets forth, for the periods indicated, the reported high and low quoted prices for our
shares on NASDAQ OMX Helsinki and the high and low quoted prices for the shares, in the form of
ADSs, on the New York Stock Exchange.
NASDAQ
OMX
Helsinki
Price per share
New York Stock
Exchange
Price per ADS
High Low High Low
(EUR) (USD)
2007 ............................................ 28.60 14.63 41.10 19.08
2008 ............................................ 25.78 9.95 38.25 12.35
2009 ............................................ 12.25 6.67 16.58 8.47
2010
First Quarter ..................................... 11.71 8.79 15.65 12.52
Second Quarter .................................. 11.82 6.61 15.89 8.00
Third Quarter ..................................... 8.28 6.59 10.29 8.21
Fourth Quarter ................................... 8.42 7.01 11.62 9.08
Full Year ........................................ 11.82 6.59 15.89 8.00
2011
First Quarter ..................................... 8.49 5.42 11.75 7.73
Second Quarter .................................. 6.36 4.03 9.42 5.79
Third Quarter ..................................... 4.79 3.33 6.84 4.82
Fourth Quarter ................................... 5.19 3.50 7.38 4.46
Full Year ........................................ 8.49 3.33 11.75 4.46
Most recent six months
September 2011 .................................. 4.79 3.75 6.84 5.13
October 2011 .................................... 5.19 3.88 7.38 5.10
November 2011 .................................. 5.00 3.98 6.91 5.27
December 2011 .................................. 4.33 3.50 5.82 4.46
January 2012 .................................... 4.46 3.75 5.78 4.93
February 2012 .................................... 4.39 3.75 5.87 4.95
9B. Plan of Distribution
Not applicable.
9C. Markets
The principal trading markets for the shares are the New York Stock Exchange, in the form of ADSs,
and NASDAQ OMX Helsinki, in the form of shares. In addition, the shares are listed on the Frankfurt
Stock Exchange. Nokia has decided to delist its shares from the Frankfurt Stock Exchange, and the
final day of trading will be March 16, 2012.
9D. Selling Shareholders
Not applicable.
9E. Dilution
Not applicable.
191