Nokia 2011 Annual Report Download - page 262
Download and view the complete annual report
Please find page 262 of the 2011 Nokia annual report below. You can navigate through the pages in the report by either clicking on the pages listed below, or by using the keyword search tool below to find specific information within the annual report.-
 1
1 -
2
-
3
-
4
-
5
-
6
-
7
-
8
-
9
-
10
-
11
-
12
-
13
-
14
-
15
-
16
-
17
-
18
-
19
-
20
-
21
-
22
-
23
-
24
-
25
-
26
-
27
-
28
-
29
-
30
-
31
-
32
-
33
-
34
-
35
-
36
-
37
-
38
-
39
-
40
-
41
-
42
-
43
-
44
-
45
-
46
-
47
-
48
-
49
-
50
-
51
-
52
-
53
-
54
-
55
-
56
-
57
-
58
-
59
-
60
-
61
-
62
-
63
-
64
-
65
-
66
-
67
-
68
-
69
-
70
-
71
-
72
-
73
-
74
-
75
-
76
-
77
-
78
-
79
-
80
-
81
-
82
-
83
-
84
-
85
-
86
-
87
-
88
-
89
-
90
-
91
-
92
-
93
-
94
-
95
-
96
-
97
-
98
-
99
-
100
-
101
-
102
-
103
-
104
-
105
-
106
-
107
-
108
-
109
-
110
-
111
-
112
-
113
-
114
-
115
-
116
-
117
-
118
-
119
-
120
-
121
-
122
-
123
-
124
-
125
-
126
-
127
-
128
-
129
-
130
-
131
-
132
-
133
-
134
-
135
-
136
-
137
-
138
-
139
-
140
-
141
-
142
-
143
-
144
-
145
-
146
-
147
-
148
-
149
-
150
-
151
-
152
-
153
-
154
-
155
-
156
-
157
-
158
-
159
-
160
-
161
-
162
-
163
-
164
-
165
-
166
-
167
-
168
-
169
-
170
-
171
-
172
-
173
-
174
-
175
-
176
-
177
-
178
-
179
-
180
-
181
-
182
-
183
-
184
-
185
-
186
-
187
-
188
-
189
-
190
-
191
-
192
-
193
-
194
-
195
-
196
-
197
-
198
-
199
-
200
-
201
-
202
-
203
-
204
-
205
-
206
-
207
-
208
-
209
-
210
-
211
-
212
-
213
-
214
-
215
-
216
-
217
-
218
-
219
-
220
-
221
-
222
-
223
-
224
-
225
-
226
-
227
-
228
-
229
-
230
-
231
-
232
-
233
-
234
-
235
-
236
-
237
-
238
-
239
-
240
-
241
-
242
-
243
-
244
-
245
-
246
-
247
-
248
-
249
-
250
-
251
-
 252
252 -
 253
253 -
 254
254 -
 255
255 -
 256
256 -
 257
257 -
 258
258 -
 259
259 -
 260
260 -
 261
261 -
 262
262 -
 263
263 -
 264
264 -
 265
265 -
 266
266 -
 267
267 -
 268
268 -
 269
269 -
 270
270 -
 271
271 -
 272
272 -
273
-
274
-
275
-
276
-
277
-
278
-
279
-
280
-
281
-
282
-
283
-
284
-
285
-
286
-
287
-
288
-
289
-
290
-
291
-
292
-
293
-
294
-
295
-
296
 |
 |

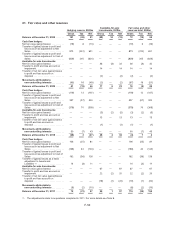
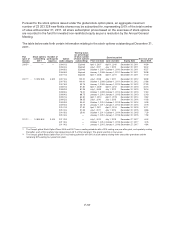
21. Fair value and other reserves
Hedging reserve, EURm
Available-for-sale
investments, EURm
Fair value and other
reserves total, EURm
Gross Tax Net Gross Tax Net Gross Tax Net
Balance at December 31, 2008 ....... 101 (20) 81 (29) 10 (19) 72 (10) 62
Cash flow hedges:
Net fair value gains (losses) .......... (19) 6 (13) — — — (19) 6 (13)
Transfer of (gains) losses to profit and
loss account as adjustment to Net
Sales ........................... 873 (222) 651 — — — 873 (222) 651
Transfer of (gains) losses to profit and
loss account as adjustment to Cost of
Sales ........................... (829) 205 (624) — — — (829) 205 (624)
Available-for-sale Investments:
Net fair value gains (losses) .......... — — — 36 (4) 32 36 (4) 32
Transfer to profit and loss account on
impairment ....................... — — — 14 — 14 14 — 14
Transfer of net fair value (gains) losses
to profit and loss account on
disposal ......................... — — — (2) — (2) (2) — (2)
Movements attributable to
non-controlling interests .......... (65) 16 (49) (2) — (2) (67) 16 (51)
Balance at December 31, 2009 ....... 61 (15) 46 17 6 23 78 (9) 69
Cash flow hedges:
Net fair value gains (losses) .......... (119) 12 (107) — — — (119) 12 (107)
Transfer of (gains) losses to profit and
loss account as adjustment to Net
Sales ........................... 357 (57) 300 — — — 357 (57) 300
Transfer of (gains) losses to profit and
loss account as adjustment to Cost of
Sales ........................... (379) 70 (309) — — — (379) 70 (309)
Available-for-sale Investments:
Net fair value gains (losses) .......... — — — (3) (2) (5) (3) (2) (5)
Transfer to profit and loss account on
impairment ....................... — — — 13 — 13 13 — 13
Transfer of net fair value (gains) losses
to profit and loss account on
disposal ......................... — — — (1) — (1) (1) — (1)
Movements attributable to
non-controlling interests .......... 50 (7) 43 — — — 50 (7) 43
Balance at December 31, 2010 ....... (30) 3 (27) 26 4 30 (4) 7 3
Cash flow hedges:
Net fair value gains (losses) .......... 106 (25) 81 — — — 106 (25) 81
Transfer of (gains) losses to profit and
loss account as adjustment to Net
Sales ........................... (166) 42 (124) — — — (166) 42 (124)
Transfer of (gains) losses to profit and
loss account as adjustment to Cost of
Sales ........................... 162 (36) 126 — — — 162 (36) 126
Transfer of (gains) losses as a basis
adjustment to Assets and
Liabilities (1) ...................... 14 (3) 11 — — — 14 (3) 11
Available-for-sale Investments:
Net fair value gains (losses) .......... — — — 67 — 67 67 — 67
Transfer to profit and loss account on
impairment ....................... — — — 22 (2) 20 22 (2) 20
Transfer of net fair value (gains)/losses
to profit and loss account on
disposal ......................... — — — (19) (1) (20) (19) (1) (20)
Movements attributable to
non-controlling interests .......... (8) (2) (10) — — — (8) (2) (10)
Balance at December 31, 2011 ....... 78 (21) 57 96 1 97 174 (20) 154
(1). The adjustments relate to acquisitions completed in 2011. For more details see Note 9.
F-52