Nokia 2011 Annual Report Download - page 183
Download and view the complete annual report
Please find page 183 of the 2011 Nokia annual report below. You can navigate through the pages in the report by either clicking on the pages listed below, or by using the keyword search tool below to find specific information within the annual report.-
 1
1 -
2
-
3
-
4
-
5
-
6
-
7
-
8
-
9
-
10
-
11
-
12
-
13
-
14
-
15
-
16
-
17
-
18
-
19
-
20
-
21
-
22
-
23
-
24
-
25
-
26
-
27
-
28
-
29
-
30
-
31
-
32
-
33
-
34
-
35
-
36
-
37
-
38
-
39
-
40
-
41
-
42
-
43
-
44
-
45
-
46
-
47
-
48
-
49
-
50
-
51
-
52
-
53
-
54
-
55
-
56
-
57
-
58
-
59
-
60
-
61
-
62
-
63
-
64
-
65
-
66
-
67
-
68
-
69
-
70
-
71
-
72
-
73
-
74
-
75
-
76
-
77
-
78
-
79
-
80
-
81
-
82
-
83
-
84
-
85
-
86
-
87
-
88
-
89
-
90
-
91
-
92
-
93
-
94
-
95
-
96
-
97
-
98
-
99
-
100
-
101
-
102
-
103
-
104
-
105
-
106
-
107
-
108
-
109
-
110
-
111
-
112
-
113
-
114
-
115
-
116
-
117
-
118
-
119
-
120
-
121
-
122
-
123
-
124
-
125
-
126
-
127
-
128
-
129
-
130
-
131
-
132
-
133
-
134
-
135
-
136
-
137
-
138
-
139
-
140
-
141
-
142
-
143
-
144
-
145
-
146
-
147
-
148
-
149
-
150
-
151
-
152
-
153
-
154
-
155
-
156
-
157
-
158
-
159
-
160
-
161
-
162
-
163
-
164
-
165
-
166
-
167
-
168
-
169
-
170
-
171
-
172
-
 173
173 -
 174
174 -
 175
175 -
 176
176 -
 177
177 -
 178
178 -
 179
179 -
 180
180 -
 181
181 -
 182
182 -
 183
183 -
 184
184 -
 185
185 -
 186
186 -
 187
187 -
 188
188 -
 189
189 -
 190
190 -
 191
191 -
 192
192 -
 193
193 -
194
-
195
-
196
-
197
-
198
-
199
-
200
-
201
-
202
-
203
-
204
-
205
-
206
-
207
-
208
-
209
-
210
-
211
-
212
-
213
-
214
-
215
-
216
-
217
-
218
-
219
-
220
-
221
-
222
-
223
-
224
-
225
-
226
-
227
-
228
-
229
-
230
-
231
-
232
-
233
-
234
-
235
-
236
-
237
-
238
-
239
-
240
-
241
-
242
-
243
-
244
-
245
-
246
-
247
-
248
-
249
-
250
-
251
-
252
-
253
-
254
-
255
-
256
-
257
-
258
-
259
-
260
-
261
-
262
-
263
-
264
-
265
-
266
-
267
-
268
-
269
-
270
-
271
-
272
-
273
-
274
-
275
-
276
-
277
-
278
-
279
-
280
-
281
-
282
-
283
-
284
-
285
-
286
-
287
-
288
-
289
-
290
-
291
-
292
-
293
-
294
-
295
-
296
 |
 |

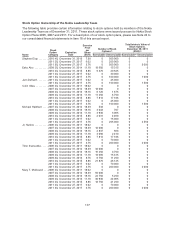
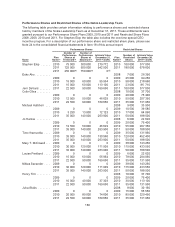
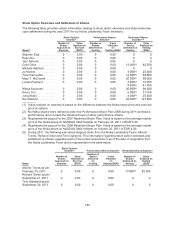
Performance Shares Restricted Shares
Name
Plan
Name(1)
Number of
Performance
Shares at
Threshold(2)
Number of
Performance
Shares at
Maximum(3)
Intrinsic Value
December 31,
2011(5) (EUR)
Plan
Name(7)
Number of
Restricted
Shares
Intrinsic Value
December 30,
2011(8) (EUR)
Kai Öistämö ...... 2009 0 0 0 2009 50 000 188 500
2010 35 000 140 000 130 560 2010 100 000 377 000
2011 22 500 90 000 169 650 2011 35 000 131 950
Performance
shares and
restricted shares
held by the Nokia
Leadership
Team,Total(9) ..... 993250 3723000 4486907 1983500 7477795
All outstanding
performance
shares and
restricted shares
(global plans),
Total ............ 7582534 30080134
(14)
45 153 423 16 586 091 62 529 563
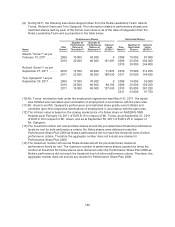
(1) The performance period for the 2009 plan is 2009-2011, for the 2010 plan 2010-2012 and for the
2011 plan 2011-2013, respectively.
(2) The threshold number will vest as Nokia shares should the pre-determined threshold performance
levels be met of both performance criteria. No Nokia shares were delivered under the
Performance Share Plan 2009 which would have vested in 2011 as Nokia’s performance did not
reach the threshold level of either performance criteria. Therefore the shares deliverable at
threshold equals zero for the Performance Share Plan 2009.
(3) The maximum number will vest as Nokia shares should the pre-determined maximum
performance levels be met of both performance criteria. The maximum number of performance
shares equals four times the number at threshold. No Nokia shares were delivered under the
Performance Share Plan 2009 as Nokia’s performance did not reach the threshold level of either
performance criteria. Therefore the shares deliverable at maximum equals zero for the
Performance Share Plan 2009.
(4) Represents the threshold and maximum number of shares under the one-time special CEO
incentive program. For the one-time special CEO incentive program, the maximum number equals
three times the number at threshold.
(5) For Performance Share Plans 2010 and 2011 the value of performance shares is presented on the
basis of Nokia’s estimation of the number of shares expected to vest. The intrinsic value for the
Performance Share Plans 2010 and 2011 is based on the closing market price of a Nokia share on
NASDAQ OMX Helsinki as at December 30, 2011 of EUR 3.77. For the Performance Share Plan
2009 no Nokia shares were delivered as Nokia’s performance did not reach the threshold level of
either performance criteria.
(6) The intrinsic value of the one-time special CEO incentive program is based on the assessment of
the two performance criteria of Total Shareholder Return relative to a peer group and Nokia’s
absolute share price as of December 31, 2011. Nokia share price is a 20-day trade volume
weighted average on NASDAQ OMX Helsinki as at December 30, 2011 of EUR 3.85.
(7) Under the Restricted Share Plans 2008, 2009, 2010 and 2011, awards have been granted
quarterly. For the major part of the awards made under these plans, the restriction period will end
for the 2008 plan on January 1, 2012; for the 2009 plan on January 1, 2013; for the 2010 plan on
January 1, 2014; and for the 2011 plan, on January 1, 2015.
(8) The intrinsic value is based on the closing market price of a Nokia share on NASDAQ OMX
Helsinki as at December 30, 2011 of EUR 3.77.
181