Nokia 2011 Annual Report Download - page 243
Download and view the complete annual report
Please find page 243 of the 2011 Nokia annual report below. You can navigate through the pages in the report by either clicking on the pages listed below, or by using the keyword search tool below to find specific information within the annual report.-
 1
1 -
2
-
3
-
4
-
5
-
6
-
7
-
8
-
9
-
10
-
11
-
12
-
13
-
14
-
15
-
16
-
17
-
18
-
19
-
20
-
21
-
22
-
23
-
24
-
25
-
26
-
27
-
28
-
29
-
30
-
31
-
32
-
33
-
34
-
35
-
36
-
37
-
38
-
39
-
40
-
41
-
42
-
43
-
44
-
45
-
46
-
47
-
48
-
49
-
50
-
51
-
52
-
53
-
54
-
55
-
56
-
57
-
58
-
59
-
60
-
61
-
62
-
63
-
64
-
65
-
66
-
67
-
68
-
69
-
70
-
71
-
72
-
73
-
74
-
75
-
76
-
77
-
78
-
79
-
80
-
81
-
82
-
83
-
84
-
85
-
86
-
87
-
88
-
89
-
90
-
91
-
92
-
93
-
94
-
95
-
96
-
97
-
98
-
99
-
100
-
101
-
102
-
103
-
104
-
105
-
106
-
107
-
108
-
109
-
110
-
111
-
112
-
113
-
114
-
115
-
116
-
117
-
118
-
119
-
120
-
121
-
122
-
123
-
124
-
125
-
126
-
127
-
128
-
129
-
130
-
131
-
132
-
133
-
134
-
135
-
136
-
137
-
138
-
139
-
140
-
141
-
142
-
143
-
144
-
145
-
146
-
147
-
148
-
149
-
150
-
151
-
152
-
153
-
154
-
155
-
156
-
157
-
158
-
159
-
160
-
161
-
162
-
163
-
164
-
165
-
166
-
167
-
168
-
169
-
170
-
171
-
172
-
173
-
174
-
175
-
176
-
177
-
178
-
179
-
180
-
181
-
182
-
183
-
184
-
185
-
186
-
187
-
188
-
189
-
190
-
191
-
192
-
193
-
194
-
195
-
196
-
197
-
198
-
199
-
200
-
201
-
202
-
203
-
204
-
205
-
206
-
207
-
208
-
209
-
210
-
211
-
212
-
213
-
214
-
215
-
216
-
217
-
218
-
219
-
220
-
221
-
222
-
223
-
224
-
225
-
226
-
227
-
228
-
229
-
230
-
231
-
232
-
 233
233 -
 234
234 -
 235
235 -
 236
236 -
 237
237 -
 238
238 -
 239
239 -
 240
240 -
 241
241 -
 242
242 -
 243
243 -
 244
244 -
 245
245 -
 246
246 -
 247
247 -
 248
248 -
 249
249 -
 250
250 -
 251
251 -
 252
252 -
 253
253 -
254
-
255
-
256
-
257
-
258
-
259
-
260
-
261
-
262
-
263
-
264
-
265
-
266
-
267
-
268
-
269
-
270
-
271
-
272
-
273
-
274
-
275
-
276
-
277
-
278
-
279
-
280
-
281
-
282
-
283
-
284
-
285
-
286
-
287
-
288
-
289
-
290
-
291
-
292
-
293
-
294
-
295
-
296
 |
 |

The expected long-term rate of return on plan assets is based on the expected return multiplied with
the respective percentage weight of the market-related value of plan assets. The expected return is
defined on a uniform basis, reflecting long-term historical returns, current market conditions and
strategic asset allocation.
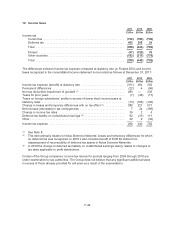
The Group’s pension plan weighted average asset allocation as a percentage of Plan Assets at
December 31, 2011, and 2010, by asset category are as follows:
2011 2010
%%
Asset category:
Equity securities ............................................................. 20 23
Debt securities ............................................................... 62 57
Insurance contracts ........................................................... 88
Short-term investments ........................................................ 34
Other ...................................................................... 78
Total ....................................................................... 100 100
The objective of the investment activities is to maximize the excess of plan assets over projected
benefit obligations, within an accepted risk level, taking into account the interest rate and inflation
sensitivity of the assets as well as the obligations. Derivative instruments can be used to change the
portfolio asset allocation and risk characteristics.
The foreign pension plan assets include a self investment through a loan provided to Nokia by the
Group’s German pension fund of EUR 69 million (EUR 69 million in 2010). See Note 31.
The actual return on plan assets was EUR 63 million in 2011 (EUR 85 million in 2010).
In 2012, the Group expects to make contributions of EUR 45 million to its defined benefit pension
plans.
6. Expenses by nature
2011 2010 2009
EURm EURm EURm
Cost of material ................................................. 18 331 20 917 19 502
Personnel expenses .............................................. 7 534 6 995 6 747
Depreciation and amortization ...................................... 1 562 1 771 1 784
Advertising and promotional expenses ............................... 1 212 1 291 1 335
Warranty costs .................................................. 671 894 696
Other costs and expenses ......................................... 8 554 8 616 8 643
Total of Cost of sales, Research and development, Selling and marketing
and Administrative and general expenses .......................... 37 864 40 484 38 707
7. Other income and expenses
Other income totaled EUR 221 million in 2011 (EUR 476 million in 2010 and EUR 338 million in 2009).
Other expenses totaled EUR 999 million in 2011 (EUR 368 million in 2010 and EUR 510 million in
2009).
F-33