Kodak 2005 Annual Report Download - page 97
Download and view the complete annual report
Please find page 97 of the 2005 Kodak annual report below. You can navigate through the pages in the report by either clicking on the pages listed below, or by using the keyword search tool below to find specific information within the annual report.-
 1
1 -
2
-
3
-
4
-
5
-
6
-
7
-
8
-
9
-
10
-
11
-
12
-
13
-
14
-
15
-
16
-
17
-
18
-
19
-
20
-
21
-
22
-
23
-
24
-
25
-
26
-
27
-
28
-
29
-
30
-
31
-
32
-
33
-
34
-
35
-
36
-
37
-
38
-
39
-
40
-
41
-
42
-
43
-
44
-
45
-
46
-
47
-
48
-
49
-
50
-
51
-
52
-
53
-
54
-
55
-
56
-
57
-
58
-
59
-
60
-
61
-
62
-
63
-
64
-
65
-
66
-
67
-
68
-
69
-
70
-
71
-
72
-
73
-
74
-
75
-
76
-
77
-
78
-
79
-
80
-
81
-
82
-
83
-
84
-
85
-
86
-
 87
87 -
 88
88 -
 89
89 -
 90
90 -
 91
91 -
 92
92 -
 93
93 -
 94
94 -
 95
95 -
 96
96 -
 97
97 -
 98
98 -
 99
99 -
 100
100 -
 101
101 -
 102
102 -
 103
103 -
 104
104 -
 105
105 -
 106
106 -
 107
107 -
108
-
109
-
110
-
111
-
112
-
113
-
114
-
115
-
116
-
117
-
118
-
119
-
120
-
121
-
122
-
123
-
124
-
125
-
126
-
127
-
128
-
129
-
130
-
131
-
132
-
133
-
134
-
135
-
136
-
137
-
138
-
139
-
140
-
141
-
142
-
143
-
144
-
145
-
146
-
147
-
148
-
149
-
150
-
151
-
152
-
153
-
154
-
155
-
156
-
157
-
158
-
159
-
160
-
161
-
162
-
163
-
164
-
165
-
166
-
167
-
168
-
169
-
170
-
171
-
172
-
173
-
174
-
175
-
176
-
177
-
178
-
179
-
180
-
181
-
182
-
183
-
184
-
185
-
186
-
187
-
188
-
189
-
190
-
191
-
192
-
193
-
194
-
195
-
196
-
197
-
198
-
199
-
200
-
201
-
202
-
203
-
204
-
205
-
206
-
207
-
208
-
209
-
210
-
211
-
212
-
213
-
214
-
215
-
216
-
217
-
218
-
219
-
220
 |
 |

95
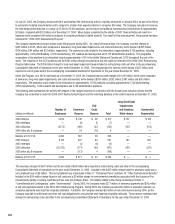
The Company also offers extended warranty arrangements to its customers that are generally one year, but may range from three months to three
years after the original warranty period. The Company provides repair services and routine maintenance under these arrangements. The Company
has not separated the extended warranty revenues and costs from the routine maintenance service revenues and costs, as it is not practicable to do
so. The change in the Company’s deferred revenue balance in relation to these extended warranty arrangements, which is refl ected in accounts
payable and other current liabilities in the accompanying Consolidated Statement of Financial Position, was as follows:
(in millions)
Deferred revenue at December 31, 2003 $ 118
New extended warranty arrangements in 2004 411
Recognition of extended warranty arrangement revenue in 2004 (388)
Deferred revenue at December 31, 2004 $ 141
New extended warranty arrangements in 2005 484
Liabilities assumed from acquisitions 45
Recognition of extended warranty arrangement revenue in 2005 (487)
Deferred revenue at December 31, 2005 $ 183
Costs incurred under these extended warranty arrangements for the year ended December 31, 2005 and December 31, 2004 amounted to
$256 million and $208 million, respectively.
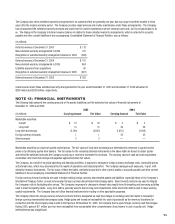
NOTE 13: FINANCIAL INSTRUMENTS
The following table presents the carrying amounts of the assets (liabilities) and the estimated fair values of fi nancial instruments at
December 31, 2005 and 2004:
2005 2004
(in millions) Carrying Amount Fair Value Carrying Amount Fair Value
Marketable securities:
Current $ 15 $ 16 $ 3 $ 3
Long-term 13 13 24 26
Long-term borrowings (2,709) (2,635) (1,852) (2,039)
Foreign currency forwards 1 1 25 25
Silver forwards 2 2 — —
Marketable securities are valued at quoted market prices. The fair values of long-term borrowings are determined by reference to quoted market
prices or by obtaining quotes from dealers. The fair values for the remaining fi nancial instruments in the above table are based on dealer quotes
and refl ect the estimated amounts the Company would pay or receive to terminate the contracts. The carrying values of cash and cash equivalents,
receivables, short-term borrowings and payables approximate their fair values.
The Company, as a result of its global operating and fi nancing activities, is exposed to changes in foreign currency exchange rates, commodity prices
and interest rates, which may adversely affect its results of operations and fi nancial position. The Company manages such exposures, in part, with
derivative fi nancial instruments. The fair value of these derivative contracts is reported in other current assets or accounts payable and other current
liabilities in the accompanying Consolidated Statement of Financial Position.
Foreign currency forward contracts are used to hedge existing foreign currency denominated assets and liabilities, especially those of the Company’s
International Treasury Center, as well as forecasted foreign currency denominated intercompany sales. Silver forward contracts are used to mitigate
the Company’s risk to fl uctuating silver prices. The Company’s exposure to changes in interest rates results from its investing and borrowing activities
used to meet its liquidity needs. Long-term debt is generally used to fi nance long-term investments, while short-term debt is used to meet working
capital requirements. The Company does not utilize fi nancial instruments for trading or other speculative purposes.
The Company enters into foreign currency forward contracts that are designated as cash fl ow hedges of exchange rate risk related to forecasted
foreign currency denominated intercompany sales. Hedge gains and losses are reclassifi ed into cost of goods sold as the inventory transferred in
connection with the intercompany sales is sold to third parties. At December 31, 2005, the Company had no open foreign currency cash fl ow hedges.
During 2005, gains of $11 million (pre-tax) were reclassifi ed from accumulated other comprehensive (loss) income to cost of goods sold. Hedge
ineffectiveness was insignifi cant.