Kodak 2005 Annual Report Download - page 85
Download and view the complete annual report
Please find page 85 of the 2005 Kodak annual report below. You can navigate through the pages in the report by either clicking on the pages listed below, or by using the keyword search tool below to find specific information within the annual report.-
 1
1 -
2
-
3
-
4
-
5
-
6
-
7
-
8
-
9
-
10
-
11
-
12
-
13
-
14
-
15
-
16
-
17
-
18
-
19
-
20
-
21
-
22
-
23
-
24
-
25
-
26
-
27
-
28
-
29
-
30
-
31
-
32
-
33
-
34
-
35
-
36
-
37
-
38
-
39
-
40
-
41
-
42
-
43
-
44
-
45
-
46
-
47
-
48
-
49
-
50
-
51
-
52
-
53
-
54
-
55
-
56
-
57
-
58
-
59
-
60
-
61
-
62
-
63
-
64
-
65
-
66
-
67
-
68
-
69
-
70
-
71
-
72
-
73
-
74
-
 75
75 -
 76
76 -
 77
77 -
 78
78 -
 79
79 -
 80
80 -
 81
81 -
 82
82 -
 83
83 -
 84
84 -
 85
85 -
 86
86 -
 87
87 -
 88
88 -
 89
89 -
 90
90 -
 91
91 -
 92
92 -
 93
93 -
 94
94 -
 95
95 -
96
-
97
-
98
-
99
-
100
-
101
-
102
-
103
-
104
-
105
-
106
-
107
-
108
-
109
-
110
-
111
-
112
-
113
-
114
-
115
-
116
-
117
-
118
-
119
-
120
-
121
-
122
-
123
-
124
-
125
-
126
-
127
-
128
-
129
-
130
-
131
-
132
-
133
-
134
-
135
-
136
-
137
-
138
-
139
-
140
-
141
-
142
-
143
-
144
-
145
-
146
-
147
-
148
-
149
-
150
-
151
-
152
-
153
-
154
-
155
-
156
-
157
-
158
-
159
-
160
-
161
-
162
-
163
-
164
-
165
-
166
-
167
-
168
-
169
-
170
-
171
-
172
-
173
-
174
-
175
-
176
-
177
-
178
-
179
-
180
-
181
-
182
-
183
-
184
-
185
-
186
-
187
-
188
-
189
-
190
-
191
-
192
-
193
-
194
-
195
-
196
-
197
-
198
-
199
-
200
-
201
-
202
-
203
-
204
-
205
-
206
-
207
-
208
-
209
-
210
-
211
-
212
-
213
-
214
-
215
-
216
-
217
-
218
-
219
-
220
 |
 |
83
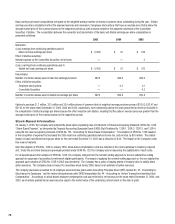
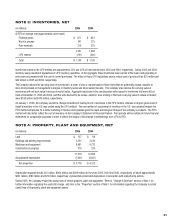
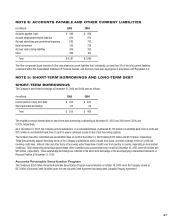
NOTE 3: INVENTORIES, NET
(in millions) 2005 2004
At FIFO or average cost (approximates current cost)
Finished goods $ 871 $ 822
Work in process 241 275
Raw materials 319 391
1,431 1,488
LIFO reserve (291) (330)
Total $ 1,140 $ 1,158
Inventories costed on the LIFO method are approximately 33% and 35% of total inventories in 2005 and 2004, respectively. During 2005 and 2004,
inventory usage resulted in liquidations of LIFO inventory quantities. In the aggregate, these inventories were carried at the lower costs prevailing in
prior years as compared with the cost of current purchases. The effect of these LIFO liquidations was to reduce cost of goods sold by $31 million and
$69 million in 2005 and 2004, respectively.
The Company reduces the carrying value of inventories to a lower of cost or market basis for those items that are potentially excess, obsolete or
slow-moving based on management’s analysis of inventory levels and future sales forecasts. The Company also reduces the carrying value of
inventories with net book value in excess of market value. Aggregate reductions in the carrying value with respect to inventories that were still on
hand at December 31, 2005 and 2004, and that were deemed to be excess, obsolete, slow-moving or that had a carrying value in excess of market,
were $148 million and $100 million, respectively.
On January 1, 2006, the Company elected to change its method of costing its U.S. inventories to the FIFO method, whereas in all prior years most of
Kodak’s inventory in the U.S. was costed using the LIFO method. The new method of accounting for inventory in the U.S. was adopted because the
FIFO method will provide for a better matching of revenue and expenses given the rapid technological change in the Company’s products. The FIFO
method will also better refl ect the cost of inventory on the Company’s Statement of Financial Position. Prior periods will be restated in future fi nancial
statements for comparative purposes in order to refl ect the impact of this change in methodology from LIFO to FIFO.
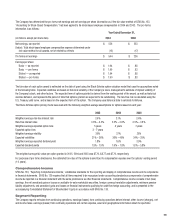
NOTE 4: PROPERTY, PLANT AND EQUIPMENT, NET
(in millions) 2005 2004
Land $ 127 $ 118
Buildings and building improvements 2,552 2,619
Machinery and equipment 8,481 9,722
Construction in progress 219 235
11,379 12,694
Accumulated depreciation (7,601) (8,182)
Net properties $ 3,778 $ 4,512
Depreciation expense was $1,281 million, $964 million and $839 million for the years 2005, 2004 and 2003, respectively, of which approximately
$391 million, $183 million and $70 million, respectively, represented accelerated depreciation in connection with restructuring actions.
During 2005, the Company revised the useful lives of certain property, plant and equipment. Refer to “Change In Estimate” section of Note 1 for
further information regarding the useful life change, and refer to the “Properties” section of Note 1 for information regarding the Company’s current
useful lives of its property, plant and equipment assets.