Kodak 2005 Annual Report Download - page 42
Download and view the complete annual report
Please find page 42 of the 2005 Kodak annual report below. You can navigate through the pages in the report by either clicking on the pages listed below, or by using the keyword search tool below to find specific information within the annual report.-
 1
1 -
2
-
3
-
4
-
5
-
6
-
7
-
8
-
9
-
10
-
11
-
12
-
13
-
14
-
15
-
16
-
17
-
18
-
19
-
20
-
21
-
22
-
23
-
24
-
25
-
26
-
27
-
28
-
29
-
30
-
31
-
 32
32 -
 33
33 -
 34
34 -
 35
35 -
 36
36 -
 37
37 -
 38
38 -
 39
39 -
 40
40 -
 41
41 -
 42
42 -
 43
43 -
 44
44 -
 45
45 -
 46
46 -
 47
47 -
 48
48 -
 49
49 -
 50
50 -
 51
51 -
 52
52 -
53
-
54
-
55
-
56
-
57
-
58
-
59
-
60
-
61
-
62
-
63
-
64
-
65
-
66
-
67
-
68
-
69
-
70
-
71
-
72
-
73
-
74
-
75
-
76
-
77
-
78
-
79
-
80
-
81
-
82
-
83
-
84
-
85
-
86
-
87
-
88
-
89
-
90
-
91
-
92
-
93
-
94
-
95
-
96
-
97
-
98
-
99
-
100
-
101
-
102
-
103
-
104
-
105
-
106
-
107
-
108
-
109
-
110
-
111
-
112
-
113
-
114
-
115
-
116
-
117
-
118
-
119
-
120
-
121
-
122
-
123
-
124
-
125
-
126
-
127
-
128
-
129
-
130
-
131
-
132
-
133
-
134
-
135
-
136
-
137
-
138
-
139
-
140
-
141
-
142
-
143
-
144
-
145
-
146
-
147
-
148
-
149
-
150
-
151
-
152
-
153
-
154
-
155
-
156
-
157
-
158
-
159
-
160
-
161
-
162
-
163
-
164
-
165
-
166
-
167
-
168
-
169
-
170
-
171
-
172
-
173
-
174
-
175
-
176
-
177
-
178
-
179
-
180
-
181
-
182
-
183
-
184
-
185
-
186
-
187
-
188
-
189
-
190
-
191
-
192
-
193
-
194
-
195
-
196
-
197
-
198
-
199
-
200
-
201
-
202
-
203
-
204
-
205
-
206
-
207
-
208
-
209
-
210
-
211
-
212
-
213
-
214
-
215
-
216
-
217
-
218
-
219
-
220
 |
 |
40
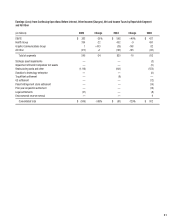
Net (Loss) Earnings
The net loss for 2005 was $1,362 million, or a loss of $4.73 per basic and diluted share, as compared with net earnings for 2004 of $556 million, or
$1.94 per basic and diluted share, representing a decrease of $1,918 million, or 345%. This decrease is attributable to the reasons outlined above.
2004 COMPARED WITH 2003
Results of Operations — Continuing Operations
Consolidated
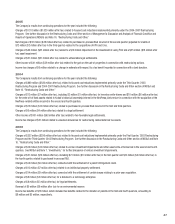
Worldwide Revenues
Net worldwide sales were $13,517 million for 2004 as compared with $12,909 million for 2003, representing an increase of $608 million, or 5%.
The increase in net sales was primarily due to increased volumes, acquisitions and favorable exchange, which increased sales for 2004 by 0.9,
4.3 and 3.0 percentage points, respectively. The increase in volumes was primarily driven by consumer digital cameras, printer dock products, and
the picture maker kiosk portion of the consumer output SPG in the Digital & Film Imaging Systems (D&FIS) segment, digital products in the Health
Group segment, partially offset by decreased volumes for traditional consumer fi lm products. Favorable exchange resulted from an increased level of
sales in non-U.S. countries as the U.S. dollar weakened throughout 2004 in relation to most foreign currencies. In addition, the acquisition of
PracticeWorks, Inc. (PracticeWorks), Versamark, Laser-Pacifi c and the NexPress-related entities accounted for an additional 4.3 percentage points of
the increase in net sales. These increases were partially offset by decreases attributable to price/mix, which reduced sales for 2004 by
approximately 3.5 percentage points. These decreases were driven primarily by price/mix declines in traditional products and services, and consumer
digital cameras in the D&FIS segment and fi lm capture and output products in the Health Group segment.
Net sales in the U.S. were $5,658 million for the current year as compared with $5,421 million for the prior year, representing an increase of
$237 million, or 4%. Net sales outside the U.S. were $7,859 million for the current year as compared with $7,488 million for the prior year,
representing an increase of $371 million, or 5%, which includes a favorable impact from exchange of 6%.
Digital Strategic Product Groups’ Revenues
The Company’s digital product sales, including new technologies product sales of $23 million, were $5,532 million for the current year as compared
with $3,978 million, including new technologies product sales of $17 million for the prior year, representing an increase of $1,554 million, or
39%, primarily driven by the consumer digital capture SPG, the kiosks/media portion of the consumer output SPG, the home printing SPG, and
digital acquisitions.
Traditional Strategic Product Groups’ Revenues
Net sales of the Company’s traditional products were $7,985 million for the current period as compared with $8,931 million for the prior year period,
representing a decrease of $946 million, or 11%, primarily driven by declines in the fi lm capture SPG and the wholesale photofi nishing portion of the
consumer output SPG.
Foreign Revenues
Net sales in EAMER for 2004 were $4,038 million as compared with $3,880 million for 2003, representing an increase of $158 million or 4%, which
includes a favorable impact from exchange of 7%. Net sales in the Asia Pacifi c region for 2004 were $2,549 million compared with $2,368 million
for 2003, representing an increase of $181 million or 8%, which includes a favorable impact from exchange of 5%. Net sales in the Canada and
Latin America region for 2004 were $1,272 million as compared with $1,240 million for 2003, representing an increase of $32 million or 3%, which
includes a favorable impact from exchange of 2%.
The Company’s major emerging markets include China, Brazil, Mexico, India, Russia, Korea, Hong Kong and Taiwan. Net sales in emerging markets
were $2,871 million for 2004 as compared with $2,591 million for 2003, representing an increase of $280 million, or 11%, which includes a favorable
impact from exchange of 1%. The emerging market portfolio accounted for approximately 21% and 37% of the Company’s worldwide and foreign
sales, respectively, in 2004. Sales growth in China, India, Russia and Brazil of 28%, 9%, 7% and 6%, respectively, were the primary drivers of the
increase in emerging market sales, partially offset by decreased sales in Hong Kong of 9%. Sales growth in China resulted from strong business
performance for Kodak’s Health Group, Graphic Communications Group and entertainment imaging products and services in 2004 as compared with
2003, when the Severe Acute Respiratory Syndrome (SARS) situation negatively impacted operations in that country, particularly for consumer and
professional products and services.
Gross Profi t
Gross profi t was $3,935 million for 2004 as compared with $4,158 million for 2003, representing a decrease of $223 million, or 5%. The gross profi t
margin was 29.1% in the current year as compared with 32.2% in the prior year. The decrease of 3.1 percentage points was attributable to declines