Kodak 2005 Annual Report Download - page 39
Download and view the complete annual report
Please find page 39 of the 2005 Kodak annual report below. You can navigate through the pages in the report by either clicking on the pages listed below, or by using the keyword search tool below to find specific information within the annual report.-
 1
1 -
2
-
3
-
4
-
5
-
6
-
7
-
8
-
9
-
10
-
11
-
12
-
13
-
14
-
15
-
16
-
17
-
18
-
19
-
20
-
21
-
22
-
23
-
24
-
25
-
26
-
27
-
28
-
 29
29 -
 30
30 -
 31
31 -
 32
32 -
 33
33 -
 34
34 -
 35
35 -
 36
36 -
 37
37 -
 38
38 -
 39
39 -
 40
40 -
 41
41 -
 42
42 -
 43
43 -
 44
44 -
 45
45 -
 46
46 -
 47
47 -
 48
48 -
 49
49 -
50
-
51
-
52
-
53
-
54
-
55
-
56
-
57
-
58
-
59
-
60
-
61
-
62
-
63
-
64
-
65
-
66
-
67
-
68
-
69
-
70
-
71
-
72
-
73
-
74
-
75
-
76
-
77
-
78
-
79
-
80
-
81
-
82
-
83
-
84
-
85
-
86
-
87
-
88
-
89
-
90
-
91
-
92
-
93
-
94
-
95
-
96
-
97
-
98
-
99
-
100
-
101
-
102
-
103
-
104
-
105
-
106
-
107
-
108
-
109
-
110
-
111
-
112
-
113
-
114
-
115
-
116
-
117
-
118
-
119
-
120
-
121
-
122
-
123
-
124
-
125
-
126
-
127
-
128
-
129
-
130
-
131
-
132
-
133
-
134
-
135
-
136
-
137
-
138
-
139
-
140
-
141
-
142
-
143
-
144
-
145
-
146
-
147
-
148
-
149
-
150
-
151
-
152
-
153
-
154
-
155
-
156
-
157
-
158
-
159
-
160
-
161
-
162
-
163
-
164
-
165
-
166
-
167
-
168
-
169
-
170
-
171
-
172
-
173
-
174
-
175
-
176
-
177
-
178
-
179
-
180
-
181
-
182
-
183
-
184
-
185
-
186
-
187
-
188
-
189
-
190
-
191
-
192
-
193
-
194
-
195
-
196
-
197
-
198
-
199
-
200
-
201
-
202
-
203
-
204
-
205
-
206
-
207
-
208
-
209
-
210
-
211
-
212
-
213
-
214
-
215
-
216
-
217
-
218
-
219
-
220
 |
 |
37
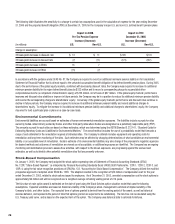
Research and Development Costs
R&D costs for the D&FIS segment decreased $89 million, or 24%, from $365 million in 2004 to $276 million in the current year period and decreased
as a percentage of sales from 4% in the prior year to 3% in the current year. The decrease in R&D was primarily attributable to spending reductions
related to traditional products and services.
Earnings From Continuing Operations Before Interest, Other Income (Charges), Net and Income Taxes
Earnings from continuing operations before interest, other income (charges), net and income taxes for the D&FIS segment were $362 million in 2005
compared with $598 million in 2004, representing a decrease of $236 million or 39%, as a result of the factors described above.
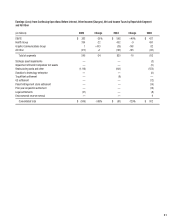
Health Group
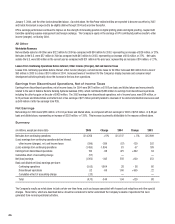
Worldwide Revenues
Net worldwide sales for the Health Group segment were $2,655 million for 2005 as compared with $2,686 million for the prior year, representing a
decrease of $31 million, or 1%. The decrease in sales was primarily attributable to decreases in price/mix of approximately 2.4 percentage points,
primarily driven by the digital capture SPG, digital output SPG, and the traditional medical fi lm portion of the fi lm capture and output SPG. These
decreases were partially offset by increases in volume, primarily driven by the digital capture SPG and the services SPG, which contributed
approximately 1.0 percentage points to the increase in sales. Sales were also favorably impacted by favorable exchange of approximately
0.3 percentage points.
Net sales in the U.S. were $1,052 million for the current year as compared with $1,114 million for 2004, representing a decrease of $62 million, or 6%.
Net sales outside the U.S. were $1,603 million for 2005 as compared with $1,572 million for the prior year, representing an increase of $31 million, or
2%, which includes a favorable impact from exchange of less than 1%.
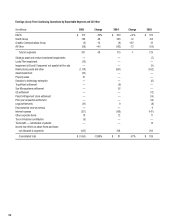
Digital Strategic Product Groups’ Revenues
Health Group segment digital sales, which include digital products (DryView laser imagers/media and wet laser printers/media), digital capture
equipment (computed radiography capture equipment and digital radiography equipment), services, dental systems (practice management software
and digital radiography capture equipment) healthcare information systems (Picture Archiving and Communications Systems (PACS)), and Radiology
Information Systems (RIS), were $1,748 million for 2005 as compared with $1,732 million for 2004, representing an increase of $16 million, or 1%.
The increase in digital product sales was primarily attributable to volume increases and favorable exchange, partially offset by negative price/mix.
Traditional Strategic Product Groups’ Revenues
Health Group segment’s traditional product sales, including analog fi lm, equipment, and chemistry, were $907 million for 2005 as compared with
$954 million for 2004, representing a decrease of $47 million, or 5%. The primary drivers were lower volumes and unfavorable price/mix for the fi lm
capture and output SPG, partially offset by favorable exchange.
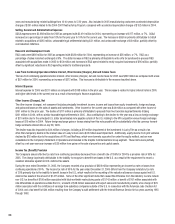
Gross Profi t
Gross profi t for the Health Group segment was $1,026 million for 2005 as compared with $1,134 million in the prior year, representing a decrease
of $108 million, or 10%. The gross profi t margin was 38.6% in the current year period as compared with 42.2% in 2004. The decrease in the
gross profi t margin of 3.6 percentage points was principally attributable to: (1) price/mix, which negatively impacted gross profi t margins by
2.6 percentage points driven by the digital capture SPG, digital output SPG and the traditional medical fi lm portion of the fi lm capture and output SPG,
and (2) an increase in manufacturing cost, which decreased gross profi t margins by approximately 1.3 percentage points due to an increase in silver
and raw material costs. These decreases were partially offset by favorable exchange, which contributed approximately 0.4 percentage points to the
gross profi t margins.
Selling, General and Administrative Expenses
SG&A expenses for the Health Group segment increased $13 million, or 3%, from $480 million in 2004 to $493 million for the current year and
increased as a percentage of sales from 18% in the prior year to 19% in the current year. The increase in SG&A expenses is primarily attributable to
increases in certain corporate overhead costs. SG&A was also negatively impacted by costs associated with the OREX acquisition of approximately
$6 million.
Research and Development Costs
Current period R&D costs were $179 million as compared with the prior year of $202 million, representing a decrease of $23 million or 11%, and
decreased as a percentage of sales from 8% to 7%. This decrease is a result of reduced R&D spending related to traditional products and services.