Kodak 2005 Annual Report Download - page 41
Download and view the complete annual report
Please find page 41 of the 2005 Kodak annual report below. You can navigate through the pages in the report by either clicking on the pages listed below, or by using the keyword search tool below to find specific information within the annual report.-
 1
1 -
2
-
3
-
4
-
5
-
6
-
7
-
8
-
9
-
10
-
11
-
12
-
13
-
14
-
15
-
16
-
17
-
18
-
19
-
20
-
21
-
22
-
23
-
24
-
25
-
26
-
27
-
28
-
29
-
30
-
 31
31 -
 32
32 -
 33
33 -
 34
34 -
 35
35 -
 36
36 -
 37
37 -
 38
38 -
 39
39 -
 40
40 -
 41
41 -
 42
42 -
 43
43 -
 44
44 -
 45
45 -
 46
46 -
 47
47 -
 48
48 -
 49
49 -
 50
50 -
 51
51 -
52
-
53
-
54
-
55
-
56
-
57
-
58
-
59
-
60
-
61
-
62
-
63
-
64
-
65
-
66
-
67
-
68
-
69
-
70
-
71
-
72
-
73
-
74
-
75
-
76
-
77
-
78
-
79
-
80
-
81
-
82
-
83
-
84
-
85
-
86
-
87
-
88
-
89
-
90
-
91
-
92
-
93
-
94
-
95
-
96
-
97
-
98
-
99
-
100
-
101
-
102
-
103
-
104
-
105
-
106
-
107
-
108
-
109
-
110
-
111
-
112
-
113
-
114
-
115
-
116
-
117
-
118
-
119
-
120
-
121
-
122
-
123
-
124
-
125
-
126
-
127
-
128
-
129
-
130
-
131
-
132
-
133
-
134
-
135
-
136
-
137
-
138
-
139
-
140
-
141
-
142
-
143
-
144
-
145
-
146
-
147
-
148
-
149
-
150
-
151
-
152
-
153
-
154
-
155
-
156
-
157
-
158
-
159
-
160
-
161
-
162
-
163
-
164
-
165
-
166
-
167
-
168
-
169
-
170
-
171
-
172
-
173
-
174
-
175
-
176
-
177
-
178
-
179
-
180
-
181
-
182
-
183
-
184
-
185
-
186
-
187
-
188
-
189
-
190
-
191
-
192
-
193
-
194
-
195
-
196
-
197
-
198
-
199
-
200
-
201
-
202
-
203
-
204
-
205
-
206
-
207
-
208
-
209
-
210
-
211
-
212
-
213
-
214
-
215
-
216
-
217
-
218
-
219
-
220
 |
 |
39
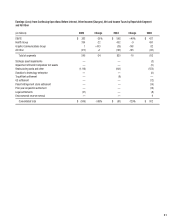
in the gross profi t margin of 1.7 percentage points was primarily attributable to: (1) reductions in manufacturing and other costs, which positively
impacted gross profi t margins by approximately 3.4 percentage points, and (2) volume increases related to Versamark products and services of
approximately 1.7 percentage points. These positive impacts on gross profi t margin were partially offset by the negative impact of acquisitions on
gross profi t margins of approximately 2.9 percentage points, and by negative price/mix of approximately 0.5 percentage points. Foreign exchange did
not have a signifi cant impact on segment gross profi t margin.
Selling, General and Administrative Expenses
SG&A expenses for the Graphic Communications Group segment were $533 million for 2005 as compared with $259 million in the prior year,
representing an increase of $274 million, or 106%, and decreased as a percentage of sales from 19% in the prior year period to 18% in the current
year period. The dollar increase in SG&A dollars is primarily attributable to the acquisitions of KPG, Creo and NexPress, while the decrease in SG&A
as a percentage of sales is primarily attributable to the increase in sales as a result of the acquisitions, as well as the fact that the acquired businesses
generally have lower SG&A as a percentage of sales.
Research and Development Costs
Current period R&D costs for the Graphic Communications Group segment increased $153 million, or 130%, from $118 million for 2004 to
$271 million for the current year, and remained constant as a percentage of sales at 9%. The dollar increase was primarily attributable to the
write-off of in-process R&D associated with the KPG and Creo acquisitions of $52 million, as well as increased levels of R&D spending associated
with the acquired companies of $95 million.
Earnings (Loss) From Continuing Operations Before Interest, Other Income (Charges), Net and Income Taxes
Earnings from continuing operations before interest, other income (charges), net and income taxes for the Graphic Communications Group segment
were $1 million in 2005 compared with a loss of $39 million in 2004. This increase in earnings of $40 million is attributable to the reasons
described above.
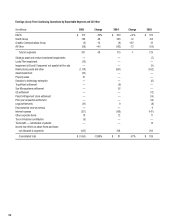
All Other
Worldwide Revenues
Net worldwide sales for All Other were $163 million for 2005 as compared with $122 million for 2004, representing an increase of $41 million, or
34%. Net sales in the U.S. were $71 million for the current year as compared with $57 million for the prior year, representing an increase of
$14 million, or 25%. Net sales outside the U.S. were $92 million in 2005 as compared with $65 million in the prior year, representing an increase of
$27 million, or 42%.
Loss From Continuing Operations Before Interest, Other Income (Charges), Net and Income Taxes
The loss from continuing operations before interest, other income (charges), net and income taxes for All Other was $177 million in the current year as
compared with a loss of $191 million in 2004, representing an increase in earnings of $14 million or 7%.
Earnings from Discontinued Operations, Net of Income Taxes
Earnings from discontinued operations for 2005 were $150 million, or $.52 per basic and diluted share and were primarily related to a $203 million
reversal of certain tax accruals as a result of a settlement between the Company and the Internal Revenue Service on the audit of the tax years 1993
through 1998. These accruals had been established in 1994 in connection with the Company’s sale of its pharmaceutical, consumer health and
household products businesses during that year. The tax accrual reversals were partially offset by a pension settlement charge of $54 million
resulting from the fi nalization of the transfer of pension assets to ITT Industries, Inc. (ITT) in connection with the sale of the Company’s Remote
Sensing Systems business (RSS) in August 2004. Earnings from discontinued operations for 2004 were $475 million or $1.66 per basic and diluted
share and were primarily related to the gain on the sale of RSS to ITT in August 2004.
Loss from Cumulative Effect of Accounting Change, Net of Income Taxes
The loss from cumulative effect of an accounting change, net of income taxes, of $57 million or $.20 per basic and diluted share is the result of the
Company’s adoption of Financial Accounting Standards Board Interpretation No. (FIN) 47, “Accounting for Conditional Asset Retirement Obligations,”
as of December 31, 2005. Under FIN 47, the Company is required to record an obligation and an asset for the present value of the estimated cost of
fulfi lling its legal obligation with respect to the retirement of an asset when the timing or method of settling that obligation is conditional upon a future
event (for example, the sale of, exiting from or disposal of an asset - the “settlement date”). The primary application of FIN 47 to the Company is
with respect to asbestos remediation. The $57 million charge represents the present value of the Company’s asset retirement obligations (net of the
related unamortized asset) relating to facilities with estimated settlement dates. Refer to further discussion in the “New Accounting Pronouncements”
section of Item 7 for further information.