Kodak 2005 Annual Report Download - page 121
Download and view the complete annual report
Please find page 121 of the 2005 Kodak annual report below. You can navigate through the pages in the report by either clicking on the pages listed below, or by using the keyword search tool below to find specific information within the annual report.-
 1
1 -
2
-
3
-
4
-
5
-
6
-
7
-
8
-
9
-
10
-
11
-
12
-
13
-
14
-
15
-
16
-
17
-
18
-
19
-
20
-
21
-
22
-
23
-
24
-
25
-
26
-
27
-
28
-
29
-
30
-
31
-
32
-
33
-
34
-
35
-
36
-
37
-
38
-
39
-
40
-
41
-
42
-
43
-
44
-
45
-
46
-
47
-
48
-
49
-
50
-
51
-
52
-
53
-
54
-
55
-
56
-
57
-
58
-
59
-
60
-
61
-
62
-
63
-
64
-
65
-
66
-
67
-
68
-
69
-
70
-
71
-
72
-
73
-
74
-
75
-
76
-
77
-
78
-
79
-
80
-
81
-
82
-
83
-
84
-
85
-
86
-
87
-
88
-
89
-
90
-
91
-
92
-
93
-
94
-
95
-
96
-
97
-
98
-
99
-
100
-
101
-
102
-
103
-
104
-
105
-
106
-
107
-
108
-
109
-
110
-
 111
111 -
 112
112 -
 113
113 -
 114
114 -
 115
115 -
 116
116 -
 117
117 -
 118
118 -
 119
119 -
 120
120 -
 121
121 -
 122
122 -
 123
123 -
 124
124 -
 125
125 -
 126
126 -
 127
127 -
 128
128 -
 129
129 -
 130
130 -
 131
131 -
132
-
133
-
134
-
135
-
136
-
137
-
138
-
139
-
140
-
141
-
142
-
143
-
144
-
145
-
146
-
147
-
148
-
149
-
150
-
151
-
152
-
153
-
154
-
155
-
156
-
157
-
158
-
159
-
160
-
161
-
162
-
163
-
164
-
165
-
166
-
167
-
168
-
169
-
170
-
171
-
172
-
173
-
174
-
175
-
176
-
177
-
178
-
179
-
180
-
181
-
182
-
183
-
184
-
185
-
186
-
187
-
188
-
189
-
190
-
191
-
192
-
193
-
194
-
195
-
196
-
197
-
198
-
199
-
200
-
201
-
202
-
203
-
204
-
205
-
206
-
207
-
208
-
209
-
210
-
211
-
212
-
213
-
214
-
215
-
216
-
217
-
218
-
219
-
220
 |
 |

119
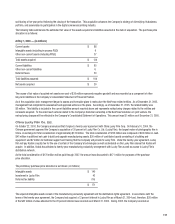
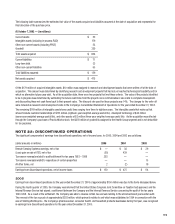
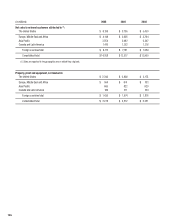
The following table summarizes the estimated fair value of the assets acquired and liabilities assumed at the date of acquisition and represents the
fi nal allocation of the purchase price.
At October 7, 2003 — (in millions)
Current assets $ 52
Intangible assets (including in-process R&D) 179
Other non-current assets (including PP&E) 53
Goodwill 350
Total assets acquired $ 634
Current liabilities $ 71
Long-term debt 23
Other non-current liabilities 65
Total liabilities assumed $ 159
Net assets acquired $ 475
Of the $179 million of acquired intangible assets, $10 million was assigned to research and development assets that were written off at the date of
acquisition. This amount was determined by identifying research and development projects that had not yet reached technological feasibility and for
which no alternative future uses exist. As of the acquisition date, there were two projects that met these criteria. The value of the projects identifi ed
to be in progress was determined by estimating the future cash fl ows from the projects once commercialized, less costs to complete development,
and discounting these net cash fl ows back to their present value. The discount rate used for these projects was 14%. The charges for the write-off
were included as research and development costs in the Company’s Consolidated Statement of Operations for the year ended December 31, 2003.
The remaining $169 million of intangible assets have useful lives ranging from three to eighteen years. The intangible assets that make up that
amount include customer relationships of $123 million (eighteen-year weighted-average useful life), developed technology of $44 million
(seven-year weighted-average useful life), and other assets of $2 million (three-year weighted-average useful life). As the acquisition was effected
through the Company’s purchase of PracticeWorks stock, the $350 million of goodwill is assigned to the Health Group segment and is not deductible
for tax purposes.
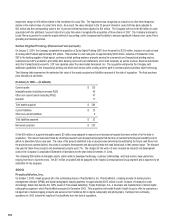
NOTE 22: DISCONTINUED OPERATIONS
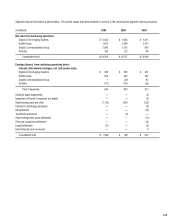
The signifi cant components of earnings from discontinued operations, net of income taxes, for 2005, 2004 and 2003 are as follows:
(dollar amounts in millions) 2005 2004 2003
Remote Sensing Systems earnings, net of tax $ — $ 38 $ 39
(Loss) gain on sale of RSS, net of tax (55) 439 —
Tax reserve reversals related to audit settlement for tax years 1993 – 1998 203 — —
Tax reserve reversals related to repurchase of certain properties — — 15
All other items, net 2 (2) 10
Earnings from discontinued operations, net of income taxes $ 150 $ 475 $ 64
2005
Earnings from discontinued operations for the year ended December 31, 2005 of approximately $150 million was due to the items discussed below.
During the fourth quarter of 2005, the Company was informed that the United States Congress Joint Committee on Taxation had approved, and the
Internal Revenue Service had signed, a settlement between the Company and the Internal Revenue Service concerning the audit of the tax years
1993-1998. As a result of the settlement, the Company was able to reverse certain tax accruals relating to the aforementioned years under audit.
The reversal of the tax accruals of approximately $203 million, which primarily relates to and which was established in 1994 in connection with the
sale of Sterling Winthrop Inc., the Company’s pharmaceutical, consumer health, and household products businesses during that year, was recognized
in earnings from discontinued operations for the year ended December 31, 2005.