Kodak 2005 Annual Report Download - page 32
Download and view the complete annual report
Please find page 32 of the 2005 Kodak annual report below. You can navigate through the pages in the report by either clicking on the pages listed below, or by using the keyword search tool below to find specific information within the annual report.-
 1
1 -
2
-
3
-
4
-
5
-
6
-
7
-
8
-
9
-
10
-
11
-
12
-
13
-
14
-
15
-
16
-
17
-
18
-
19
-
20
-
21
-
 22
22 -
 23
23 -
 24
24 -
 25
25 -
 26
26 -
 27
27 -
 28
28 -
 29
29 -
 30
30 -
 31
31 -
 32
32 -
 33
33 -
 34
34 -
 35
35 -
 36
36 -
 37
37 -
 38
38 -
 39
39 -
 40
40 -
 41
41 -
 42
42 -
43
-
44
-
45
-
46
-
47
-
48
-
49
-
50
-
51
-
52
-
53
-
54
-
55
-
56
-
57
-
58
-
59
-
60
-
61
-
62
-
63
-
64
-
65
-
66
-
67
-
68
-
69
-
70
-
71
-
72
-
73
-
74
-
75
-
76
-
77
-
78
-
79
-
80
-
81
-
82
-
83
-
84
-
85
-
86
-
87
-
88
-
89
-
90
-
91
-
92
-
93
-
94
-
95
-
96
-
97
-
98
-
99
-
100
-
101
-
102
-
103
-
104
-
105
-
106
-
107
-
108
-
109
-
110
-
111
-
112
-
113
-
114
-
115
-
116
-
117
-
118
-
119
-
120
-
121
-
122
-
123
-
124
-
125
-
126
-
127
-
128
-
129
-
130
-
131
-
132
-
133
-
134
-
135
-
136
-
137
-
138
-
139
-
140
-
141
-
142
-
143
-
144
-
145
-
146
-
147
-
148
-
149
-
150
-
151
-
152
-
153
-
154
-
155
-
156
-
157
-
158
-
159
-
160
-
161
-
162
-
163
-
164
-
165
-
166
-
167
-
168
-
169
-
170
-
171
-
172
-
173
-
174
-
175
-
176
-
177
-
178
-
179
-
180
-
181
-
182
-
183
-
184
-
185
-
186
-
187
-
188
-
189
-
190
-
191
-
192
-
193
-
194
-
195
-
196
-
197
-
198
-
199
-
200
-
201
-
202
-
203
-
204
-
205
-
206
-
207
-
208
-
209
-
210
-
211
-
212
-
213
-
214
-
215
-
216
-
217
-
218
-
219
-
220
 |
 |

30
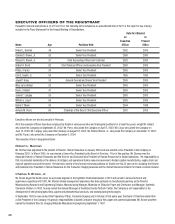
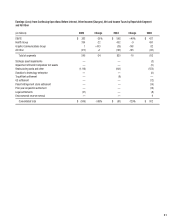
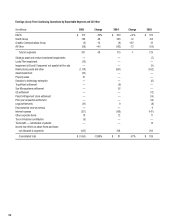
Detailed Results of Operations
Net Sales from Continuing Operations by Reportable Segment and All Other (1)
(in millions) 2005 Change 2004 Change 2003
D&FIS
Inside the U.S. $ 3,777 -3% $ 3,900 0% $ 3,900
Outside the U.S. 4,683 -14 5,466 -1 5,515
Total D&FIS 8,460 -10 9,366 -1 9,415
Health Group
Inside the U.S. 1,052 -6 1,114 +5 1,061
Outside the U.S. 1,603 +2 1,572 +15 1,370
Total Health Group 2,655 -1 2,686 +10 2,431
Graphic Communications Group
Inside the U.S. 1,079 +84 587 +41 415
Outside the U.S. 1,911 +153 756 +37 552
Total Graphic Communications Group 2,990 +123 1,343 +39 967
All Other
Inside the U.S. 71 +25 57 +27 45
Outside the U.S. 92 +42 65 +27 51
Total All Other 163 +34 122 +27 96
Total Net Sales $ 14,268 +6% $ 13,517 +5% $ 12,909
(1) Sales are reported based on the geographic area of destination.