Kodak 2005 Annual Report Download - page 38
Download and view the complete annual report
Please find page 38 of the 2005 Kodak annual report below. You can navigate through the pages in the report by either clicking on the pages listed below, or by using the keyword search tool below to find specific information within the annual report.-
 1
1 -
2
-
3
-
4
-
5
-
6
-
7
-
8
-
9
-
10
-
11
-
12
-
13
-
14
-
15
-
16
-
17
-
18
-
19
-
20
-
21
-
22
-
23
-
24
-
25
-
26
-
27
-
 28
28 -
 29
29 -
 30
30 -
 31
31 -
 32
32 -
 33
33 -
 34
34 -
 35
35 -
 36
36 -
 37
37 -
 38
38 -
 39
39 -
 40
40 -
 41
41 -
 42
42 -
 43
43 -
 44
44 -
 45
45 -
 46
46 -
 47
47 -
 48
48 -
49
-
50
-
51
-
52
-
53
-
54
-
55
-
56
-
57
-
58
-
59
-
60
-
61
-
62
-
63
-
64
-
65
-
66
-
67
-
68
-
69
-
70
-
71
-
72
-
73
-
74
-
75
-
76
-
77
-
78
-
79
-
80
-
81
-
82
-
83
-
84
-
85
-
86
-
87
-
88
-
89
-
90
-
91
-
92
-
93
-
94
-
95
-
96
-
97
-
98
-
99
-
100
-
101
-
102
-
103
-
104
-
105
-
106
-
107
-
108
-
109
-
110
-
111
-
112
-
113
-
114
-
115
-
116
-
117
-
118
-
119
-
120
-
121
-
122
-
123
-
124
-
125
-
126
-
127
-
128
-
129
-
130
-
131
-
132
-
133
-
134
-
135
-
136
-
137
-
138
-
139
-
140
-
141
-
142
-
143
-
144
-
145
-
146
-
147
-
148
-
149
-
150
-
151
-
152
-
153
-
154
-
155
-
156
-
157
-
158
-
159
-
160
-
161
-
162
-
163
-
164
-
165
-
166
-
167
-
168
-
169
-
170
-
171
-
172
-
173
-
174
-
175
-
176
-
177
-
178
-
179
-
180
-
181
-
182
-
183
-
184
-
185
-
186
-
187
-
188
-
189
-
190
-
191
-
192
-
193
-
194
-
195
-
196
-
197
-
198
-
199
-
200
-
201
-
202
-
203
-
204
-
205
-
206
-
207
-
208
-
209
-
210
-
211
-
212
-
213
-
214
-
215
-
216
-
217
-
218
-
219
-
220
 |
 |
36
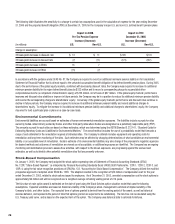
D&FIS segment net sales in the U.S. were $3,777 million for the current year as compared with $3,900 million for the prior year, representing a
decrease of $123 million, or 3%. D&FIS segment net sales outside the U.S. were $4,683 million for the current year as compared with $5,466 million
for the prior year, representing a decrease of $783 million, or 14%, which includes a favorable impact from exchange of 1%.
Digital Strategic Product Groups’ Revenues
D&FIS segment digital product sales were $3,412 million for 2005 as compared with $2,641 million for 2004, representing an increase of
$771 million, or 29%, primarily driven by the consumer digital capture SPG, the kiosks/media portion of the consumer output SPG, and the home
printing SPG. Net worldwide sales of consumer digital capture products, which include consumer digital cameras, accessories, memory products, and
royalties, increased 30% in 2005 as compared with the prior year, primarily refl ecting strong volume increases and favorable exchange, partially offset
by negative price/mix.
Net worldwide sales of picture maker kiosks/media increased 37% in 2005 as compared with 2004, as a result of strong volume increases and
favorable exchange. Sales continue to be driven by strong market acceptance of Kodak’s new generation of kiosks and an increase in consumer
demand for digital printing at retail.
Net worldwide sales of the home printing solutions SPG, which includes inkjet photo paper and printer docks/media, increased 57% in 2005 as
compared with 2004 driven by sales of printer docks and associated thermal media. For full year 2005, Kodak’s printer dock product held the
number-one market share position (on a unit basis) in the United States, Canada, Germany, Australia and the United Kingdom. However, inkjet paper
sales in 2005 declined year over year, as volume growth was more than offset by lower pricing. Industry growth for inkjet paper continues to slow as
a result of improving retail printing solutions, and alternative home printing solutions.
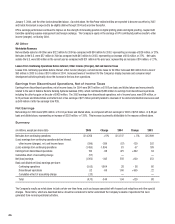
Traditional Strategic Product Groups’ Revenues
D&FIS segment’s traditional product sales were $5,048 million for the current year period as compared with $6,725 million for the prior year,
representing a decrease of $1,677 million or 25%, primarily driven by declines in the fi lm capture SPG and the consumer output SPG. Net
worldwide sales of the fi lm capture SPG, including consumer roll fi lm (35mm and APS fi lm), one-time-use cameras (OTUC), professional fi lms,
reloadable traditional fi lm cameras and batteries/videotape, decreased 31% in 2005 as compared with 2004, primarily refl ecting volume declines
and negative price/mix, partially offset by favorable exchange.
U.S. consumer fi lm industry sell-through volumes decreased approximately 25% in 2005 as compared with the prior year. Kodak’s sell-in consumer
fi lm volumes declined approximately 36% in the current year as compared with the prior year, refl ecting a continuing reduction in U.S. retailer
inventories as well as a decline in market share.
Net worldwide sales for the retail photofi nishing SPG, which includes color negative paper, minilab equipment and services, chemistry, and
photofi nishing services at retail, decreased 27% in 2005 as compared with 2004, primarily refl ecting volume declines and negative price/mix partially
offset by favorable exchange. The volume declines are the result of the substantial reduction of direct sale of minilab equipment. The Company has
shifted its focus to providing minilab services.
Net worldwide sales for the wholesale photofi nishing SPG, which includes color negative paper, equipment, chemistry and photofi nishing services
at Qualex in the U.S. and CIS (Consumer Imaging Services) outside the U.S., decreased 46% in 2005 as compared with 2004, refl ecting continuing
volume declines partially offset by favorable exchange.
Net worldwide sales for the entertainment fi lm SPGs, including origination and print fi lms for the entertainment industry increased 1%, primarily
refl ecting volume increases and favorable exchange, partially offset by overall negative price/mix.
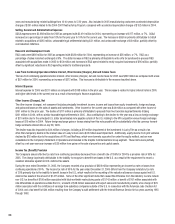
Gross Profi t
Gross profi t for the D&FIS segment was $2,226 million for 2005 as compared with $2,644 million for the prior year period, representing a decrease
of $418 million or 16%. The gross profi t margin was 26.3% in the current year as compared with 28.2% in the prior year. The 1.9 percentage point
decrease was primarily attributable to negative price/mix, primarily driven by the fi lm capture SPG and the digital capture SPG which reduced gross
profi t margins by approximately 5.0 percentage points, partially offset by the year-over-year increase in royalty income relating to digital capture.
Declines in price/mix were partially offset by positive results from initiatives to reduce manufacturing costs, which improved gross profi t margins by
approximately 2.8 percentage points, and foreign exchange, which favorably impacted gross profi t margins by approximately 0.5 percentage points.
Selling, General and Administrative Expenses
SG&A expenses for the D&FIS segment decreased $93 million, or 6%, from $1,681 million in 2004 to $1,588 million in the current year, and increased
as a percentage of sales from 18% for 2004 to 19% for the current year. The dollar decrease is primarily attributable to cost reduction actions. These
cost reduction actions are being outpaced by the decline of traditional product sales, which resulted in a minor year-over-year increase of SG&A as a
percentage of sales.