Kodak 2005 Annual Report Download - page 132
Download and view the complete annual report
Please find page 132 of the 2005 Kodak annual report below. You can navigate through the pages in the report by either clicking on the pages listed below, or by using the keyword search tool below to find specific information within the annual report.-
 1
1 -
2
-
3
-
4
-
5
-
6
-
7
-
8
-
9
-
10
-
11
-
12
-
13
-
14
-
15
-
16
-
17
-
18
-
19
-
20
-
21
-
22
-
23
-
24
-
25
-
26
-
27
-
28
-
29
-
30
-
31
-
32
-
33
-
34
-
35
-
36
-
37
-
38
-
39
-
40
-
41
-
42
-
43
-
44
-
45
-
46
-
47
-
48
-
49
-
50
-
51
-
52
-
53
-
54
-
55
-
56
-
57
-
58
-
59
-
60
-
61
-
62
-
63
-
64
-
65
-
66
-
67
-
68
-
69
-
70
-
71
-
72
-
73
-
74
-
75
-
76
-
77
-
78
-
79
-
80
-
81
-
82
-
83
-
84
-
85
-
86
-
87
-
88
-
89
-
90
-
91
-
92
-
93
-
94
-
95
-
96
-
97
-
98
-
99
-
100
-
101
-
102
-
103
-
104
-
105
-
106
-
107
-
108
-
109
-
110
-
111
-
112
-
113
-
114
-
115
-
116
-
117
-
118
-
119
-
120
-
121
-
 122
122 -
 123
123 -
 124
124 -
 125
125 -
 126
126 -
 127
127 -
 128
128 -
 129
129 -
 130
130 -
 131
131 -
 132
132 -
 133
133 -
 134
134 -
 135
135 -
 136
136 -
 137
137 -
 138
138 -
 139
139 -
 140
140 -
 141
141 -
 142
142 -
143
-
144
-
145
-
146
-
147
-
148
-
149
-
150
-
151
-
152
-
153
-
154
-
155
-
156
-
157
-
158
-
159
-
160
-
161
-
162
-
163
-
164
-
165
-
166
-
167
-
168
-
169
-
170
-
171
-
172
-
173
-
174
-
175
-
176
-
177
-
178
-
179
-
180
-
181
-
182
-
183
-
184
-
185
-
186
-
187
-
188
-
189
-
190
-
191
-
192
-
193
-
194
-
195
-
196
-
197
-
198
-
199
-
200
-
201
-
202
-
203
-
204
-
205
-
206
-
207
-
208
-
209
-
210
-
211
-
212
-
213
-
214
-
215
-
216
-
217
-
218
-
219
-
220
 |
 |

130
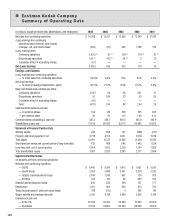
(in millions, except per share data, shareholders, and employees) 2005 2004 2003 2002 2001
Net sales from continuing operations $ 14,268 $ 13,517 $ 12,909 $ 12,549 $ 12,976
(Loss) earnings from continuing
operations before interest, other income
(charges), net, and income taxes (599) (87) 302 1,168 319
(Loss) earnings from:
Continuing operations (1,455) (1) 81 (2) 189
(3) 761 (4) 61 (5)
Discontinued operations 150 (6) 475 (6) 64 (6) 9 15
Cumulative effect of accounting change (57) — — — —
Net (Loss) Earnings (1,362) 556 253 770 76
Earnings and Dividends
(Loss) earnings from continuing operations
— % of net sales from continuing operations (10.2)% 0.6% 1.5% 6.1% 0 . 5 %
Net (loss) earnings
— % return on average shareholders’ equity (47.1)% 15.7% 8.4% 27.2% 2. 4 %
Basic and diluted (loss) earnings per share:
Continuing operations (5.05) .28 .66 2.61 .21
Discontinued operations .52 1.66 .22 .03 .05
Cumulative effect of accounting change (.20) — — — —
Total (4.73) 1.94 .88 2.64 .26
Cash dividends declared and paid
— on common shares 144 143 330 525 643
— per common share .50 .50 1.15 1.80 2.21
Common shares outstanding at year end 287.2 286.7 286.6 285.9 2 9 0 . 9
Shareholders at year end 75,619 80,426 85,712 89,988 9 1,8 93
Statement of Financial Position Data
Working capital 292 658 197 (968) (737)
Property, plant and equipment, net 3,778 4,512 5,051 5,378 5 , 6 1 8
Total assets 14,921 14,737 14,846 13,494 13,362
Short-term borrowings and current portion of long-term debt 819 469 946 1,442 1,534
Long-term debt, net of current portion 2,764 1,852 2,302 1,164 1,6 6 6
Total shareholders’ equity 1,967 3,820 3,245 2,777 2,894
Supplemental Information
(all amounts are from continuing operations)
Net sales from continuing operations
— D&FIS $ 8,460 $ 9,366 $ 9,415 $ 9,161 $ 9,565
— Health Group 2,655 2,686 2,431 2,274 2 , 2 6 2
— Graphic Communications Group 2,990 1,343 967 724 786
— All Other 163 122 96 390 363
Research and development costs 892 836 760 757 777
Depreciation 1,281 964 839 813 760
Taxes (excludes payroll, sales and excise taxes) 798 (100) 4 268 14 2
Wages, salaries and employee benefi ts 3,941 4,188 3,960 3,906 3 ,74 4
Employees at year end
— in the U.S. 25,500 29,200 33,800 37,9 0 0 4 0 ,9 0 0
— worldwide 51,100 54,800 62,300 68,900 74,000
Eastman Kodak Company
Summary of Operating Data