Kodak 2005 Annual Report Download - page 30
Download and view the complete annual report
Please find page 30 of the 2005 Kodak annual report below. You can navigate through the pages in the report by either clicking on the pages listed below, or by using the keyword search tool below to find specific information within the annual report.-
 1
1 -
2
-
3
-
4
-
5
-
6
-
7
-
8
-
9
-
10
-
11
-
12
-
13
-
14
-
15
-
16
-
17
-
18
-
19
-
 20
20 -
 21
21 -
 22
22 -
 23
23 -
 24
24 -
 25
25 -
 26
26 -
 27
27 -
 28
28 -
 29
29 -
 30
30 -
 31
31 -
 32
32 -
 33
33 -
 34
34 -
 35
35 -
 36
36 -
 37
37 -
 38
38 -
 39
39 -
 40
40 -
41
-
42
-
43
-
44
-
45
-
46
-
47
-
48
-
49
-
50
-
51
-
52
-
53
-
54
-
55
-
56
-
57
-
58
-
59
-
60
-
61
-
62
-
63
-
64
-
65
-
66
-
67
-
68
-
69
-
70
-
71
-
72
-
73
-
74
-
75
-
76
-
77
-
78
-
79
-
80
-
81
-
82
-
83
-
84
-
85
-
86
-
87
-
88
-
89
-
90
-
91
-
92
-
93
-
94
-
95
-
96
-
97
-
98
-
99
-
100
-
101
-
102
-
103
-
104
-
105
-
106
-
107
-
108
-
109
-
110
-
111
-
112
-
113
-
114
-
115
-
116
-
117
-
118
-
119
-
120
-
121
-
122
-
123
-
124
-
125
-
126
-
127
-
128
-
129
-
130
-
131
-
132
-
133
-
134
-
135
-
136
-
137
-
138
-
139
-
140
-
141
-
142
-
143
-
144
-
145
-
146
-
147
-
148
-
149
-
150
-
151
-
152
-
153
-
154
-
155
-
156
-
157
-
158
-
159
-
160
-
161
-
162
-
163
-
164
-
165
-
166
-
167
-
168
-
169
-
170
-
171
-
172
-
173
-
174
-
175
-
176
-
177
-
178
-
179
-
180
-
181
-
182
-
183
-
184
-
185
-
186
-
187
-
188
-
189
-
190
-
191
-
192
-
193
-
194
-
195
-
196
-
197
-
198
-
199
-
200
-
201
-
202
-
203
-
204
-
205
-
206
-
207
-
208
-
209
-
210
-
211
-
212
-
213
-
214
-
215
-
216
-
217
-
218
-
219
-
220
 |
 |

28
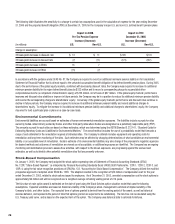
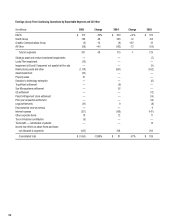
The following table illustrates the sensitivity to a change to certain key assumptions used in the calculation of expense for the year ending December
31, 2006 and the projected benefi t obligation (PBO) at December 31, 2005 for the Company’s major U.S. and non-U.S. defi ned benefi t pension plans:
Impact on 2006 Impact on PBO
Pre-Tax Pension Expense December 31, 2005
Increase (Decrease) Increase (Decrease)
(in millions) U.S. Non-U.S. U.S. Non-U.S.
Change in assumption:
25 basis point decrease in discount rate $ 12 $ 11 $ 185 $ 141
25 basis point increase in discount rate (7) (11) (172) (132)
25 basis point decrease in EROA 15 7
25 basis point increase in EROA (15) (7)
In accordance with the guidance under SFAS No. 87, the Company is required to record an additional minimum pension liability in its Consolidated
Statement of Financial Position that is at least equal to the unfunded accumulated benefi t obligation of its defi ned benefi t pension plans. During 2005,
due to the performance of the global equity markets, combined with decreasing discount rates, the Company was required to increase its additional
minimum pension liability for its major defi ned benefi t plans by $223 million and to record a corresponding charge to accumulated other
comprehensive income (a component of shareholders’ equity) of $156 million, net of taxes of $67 million. If the global equity markets’ performance
improves and discount rates stabilize or improve in future periods, the Company may be in a position to reduce its additional minimum pension liability
and reverse the corresponding charges to shareholders’ equity. Conversely, if the global equity markets’ performance and discount rates continue to
decline in future periods, the Company may be required to increase its additional minimum pension liability and record additional charges to
shareholders’ equity. To mitigate the increase in its additional minimum pension liability and additional charges to shareholders’ equity, the Company
may elect to fund a particular plan or plans on a case-by-case basis.
Environmental Commitments
Environmental liabilities are accrued based on estimates of known environmental remediation exposures. The liabilities include accruals for sites
owned by Kodak, sites formerly owned by Kodak, and other third party sites where Kodak was designated as a potentially responsible party (PRP).
The amounts accrued for such sites are based on these estimates, which are determined using the ASTM Standard E 2137-01, “Standard Guide for
Estimating Monetary Costs and Liabilities for Environmental Matters.” The overall method includes the use of a probabilistic model that forecasts a
range of cost estimates for the remediation required at individual sites. The Company’s estimate includes equipment and operating costs for
remediation and long-term monitoring of the sites. Such estimates may be affected by changing determinations of what constitutes an environmental
liability or an acceptable level of remediation. Kodak’s estimate of its environmental liabilities may also change if the proposals to regulatory agencies
for desired methods and outcomes of remediation are viewed as not acceptable, or additional exposures are identifi ed. The Company has an ongoing
monitoring and identifi cation process to assess how activities, with respect to the known exposures, are progressing against the accrued cost
estimates, as well as to identify other potential remediation sites that are presently unknown.
Stock-Based Compensation
On January 1, 2005, the Company early adopted the stock option expensing rules of Statement of Financial Accounting Standards (SFAS)
No. 123R, “Share-Based Payment,” as interpreted by Financial Accounting Standards Board (FASB) Staff Positions No. 123R-1, 123R-2, 123R-3, and
123R-4, using the fair value recognition provisions of SFAS No. 123, “Accounting for Stock-Based Compensation.” The Company utilized the modifi ed
prospective approach of adoption under SFAS No. 123R. The adoption resulted in the recognition of $16 million of compensation cost for the year
ended December 31, 2005, related to stock options issued to employees. As of December 31, 2005, unvested compensation cost for stock options is
approximately $9 million and will be recognized over a weighted-average remaining vesting period of 2.14 years.
The fair value of each option award is estimated on the date of grant using the Black-Scholes option valuation model that uses the following
assumptions. Expected volatilities are based on historical volatility of the Company’s stock, management’s estimate of implied volatility of the
Company’s stock, and other factors. The expected term of options granted is derived from the vesting period of the award, as well as historical
exercise behavior, and represents the period of time that options granted are expected to be outstanding. The risk-free rate is calculated using the
U.S. Treasury yield curve, and is based on the expected term of the option. The Company uses historical data to estimate forfeitures.