Kodak 2005 Annual Report Download - page 126
Download and view the complete annual report
Please find page 126 of the 2005 Kodak annual report below. You can navigate through the pages in the report by either clicking on the pages listed below, or by using the keyword search tool below to find specific information within the annual report.-
 1
1 -
2
-
3
-
4
-
5
-
6
-
7
-
8
-
9
-
10
-
11
-
12
-
13
-
14
-
15
-
16
-
17
-
18
-
19
-
20
-
21
-
22
-
23
-
24
-
25
-
26
-
27
-
28
-
29
-
30
-
31
-
32
-
33
-
34
-
35
-
36
-
37
-
38
-
39
-
40
-
41
-
42
-
43
-
44
-
45
-
46
-
47
-
48
-
49
-
50
-
51
-
52
-
53
-
54
-
55
-
56
-
57
-
58
-
59
-
60
-
61
-
62
-
63
-
64
-
65
-
66
-
67
-
68
-
69
-
70
-
71
-
72
-
73
-
74
-
75
-
76
-
77
-
78
-
79
-
80
-
81
-
82
-
83
-
84
-
85
-
86
-
87
-
88
-
89
-
90
-
91
-
92
-
93
-
94
-
95
-
96
-
97
-
98
-
99
-
100
-
101
-
102
-
103
-
104
-
105
-
106
-
107
-
108
-
109
-
110
-
111
-
112
-
113
-
114
-
115
-
 116
116 -
 117
117 -
 118
118 -
 119
119 -
 120
120 -
 121
121 -
 122
122 -
 123
123 -
 124
124 -
 125
125 -
 126
126 -
 127
127 -
 128
128 -
 129
129 -
 130
130 -
 131
131 -
 132
132 -
 133
133 -
 134
134 -
 135
135 -
 136
136 -
137
-
138
-
139
-
140
-
141
-
142
-
143
-
144
-
145
-
146
-
147
-
148
-
149
-
150
-
151
-
152
-
153
-
154
-
155
-
156
-
157
-
158
-
159
-
160
-
161
-
162
-
163
-
164
-
165
-
166
-
167
-
168
-
169
-
170
-
171
-
172
-
173
-
174
-
175
-
176
-
177
-
178
-
179
-
180
-
181
-
182
-
183
-
184
-
185
-
186
-
187
-
188
-
189
-
190
-
191
-
192
-
193
-
194
-
195
-
196
-
197
-
198
-
199
-
200
-
201
-
202
-
203
-
204
-
205
-
206
-
207
-
208
-
209
-
210
-
211
-
212
-
213
-
214
-
215
-
216
-
217
-
218
-
219
-
220
 |
 |

124
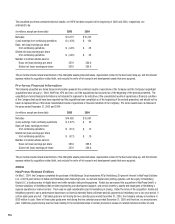
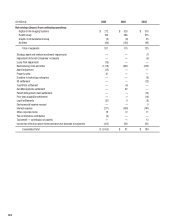
(in millions) 2005 2004 2003
Net earnings (losses) from continuing operations:
Digital & Film Imaging Systems $ 212 $ 520 $ 370
Health Group 196 366 415
Graphic Communications Group (9) (8) 35
All Other (98) (163) (95)
Total of segments 301 715 725
Strategic asset and venture investment impairments — — (7)
Impairment of Burrell Companies’ net assets — — (9)
Lucky Film impairment (19) — —
Restructuring costs and other (1,118) (901) (552)
Asset impairment (25) — —
Property sales 41 — —
Donation to technology enterprise — — (8)
GE settlement — — (12)
TouchPoint settlement — (6) —
Sun Microsystems settlement — 92 —
Patent infringement claim settlement — — (14)
Prior year acquisition settlement — — (14)
Legal settlements (21) 9 (8)
Environmental reserve reversal — — 9
Interest expense (211) (168) (147)
Other corporate items 18 12 11
Tax on Infotonics contribution (6) — —
Tax benefi t — contribution of patents — — 13
Income tax effects on above items and taxes not allocated to segments (415) 328 202
Consolidated total $ (1,455) $ 81 $ 189