Kodak 2005 Annual Report Download - page 54
Download and view the complete annual report
Please find page 54 of the 2005 Kodak annual report below. You can navigate through the pages in the report by either clicking on the pages listed below, or by using the keyword search tool below to find specific information within the annual report.-
 1
1 -
2
-
3
-
4
-
5
-
6
-
7
-
8
-
9
-
10
-
11
-
12
-
13
-
14
-
15
-
16
-
17
-
18
-
19
-
20
-
21
-
22
-
23
-
24
-
25
-
26
-
27
-
28
-
29
-
30
-
31
-
32
-
33
-
34
-
35
-
36
-
37
-
38
-
39
-
40
-
41
-
42
-
43
-
 44
44 -
 45
45 -
 46
46 -
 47
47 -
 48
48 -
 49
49 -
 50
50 -
 51
51 -
 52
52 -
 53
53 -
 54
54 -
 55
55 -
 56
56 -
 57
57 -
 58
58 -
 59
59 -
 60
60 -
 61
61 -
 62
62 -
 63
63 -
 64
64 -
65
-
66
-
67
-
68
-
69
-
70
-
71
-
72
-
73
-
74
-
75
-
76
-
77
-
78
-
79
-
80
-
81
-
82
-
83
-
84
-
85
-
86
-
87
-
88
-
89
-
90
-
91
-
92
-
93
-
94
-
95
-
96
-
97
-
98
-
99
-
100
-
101
-
102
-
103
-
104
-
105
-
106
-
107
-
108
-
109
-
110
-
111
-
112
-
113
-
114
-
115
-
116
-
117
-
118
-
119
-
120
-
121
-
122
-
123
-
124
-
125
-
126
-
127
-
128
-
129
-
130
-
131
-
132
-
133
-
134
-
135
-
136
-
137
-
138
-
139
-
140
-
141
-
142
-
143
-
144
-
145
-
146
-
147
-
148
-
149
-
150
-
151
-
152
-
153
-
154
-
155
-
156
-
157
-
158
-
159
-
160
-
161
-
162
-
163
-
164
-
165
-
166
-
167
-
168
-
169
-
170
-
171
-
172
-
173
-
174
-
175
-
176
-
177
-
178
-
179
-
180
-
181
-
182
-
183
-
184
-
185
-
186
-
187
-
188
-
189
-
190
-
191
-
192
-
193
-
194
-
195
-
196
-
197
-
198
-
199
-
200
-
201
-
202
-
203
-
204
-
205
-
206
-
207
-
208
-
209
-
210
-
211
-
212
-
213
-
214
-
215
-
216
-
217
-
218
-
219
-
220
 |
 |
52
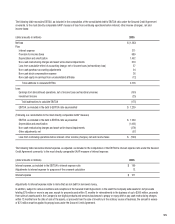
The above savings estimates are based primarily on objective data related to the Company’s severance actions. Savings resulting from facility
closures and other non-severance actions that are more diffi cult to quantify are not included. The Company reaffi rms its estimate of total annual cost
savings under the extended 2004-2007 Restructuring Program of $1.6 billion to $1.8 billion, as announced in July 2005, and does not expect the fi nal
annual cost savings to differ materially from this estimate.
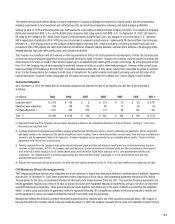
Pre-2004 Restructuring Programs
At December 31, 2005, the Company had remaining severance and exit costs reserves of $2 million and $13 million, respectively, relating to
restructuring plans committed to or executed prior to 2004. During 2005, reversals of $3 million were made to reduce the severance reserve balance,
as severance payments were less than originally estimated. During 2005, reversals of $3 million were made to reduce the exit costs reserve balance,
as the Company was able to settle lease and other exit cost obligations for amounts that were less than originally estimated.
The remaining severance payments relate to initiatives already implemented under the Pre-2004 Restructuring Programs and will be paid out during
2006 since, in many instances, the employees whose positions were eliminated can elect or are required to receive their severance payments over an
extended period of time. Most of the remaining exit costs reserves represent long-term lease payments, which will continue to be paid over periods
throughout and after 2006.
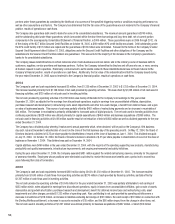
Liquidity and Capital Resources
2005
Cash Flow Activity
The Company’s cash and cash equivalents increased $410 million to $1,665 million at December 31, 2005 from $1,255 million at December 31, 2004.
The increase resulted primarily from $1,208 million of net cash provided by operating activities and $533 million of net cash provided by fi nancing
activities, offset by $1,304 million of net cash used in investing activities.
The net cash provided by operating activities of $1,208 million was primarily attributable to a decrease in receivables, excluding the impacts of
acquisitions, of $228 million, and a decrease in inventories, excluding the impacts of acquisitions, of $274 million. The decrease in receivables,
excluding the impacts of acquisitions, is primarily due to lower customer rebate accruals and lower miscellaneous non-trade receivables, and was
also impacted by the Company’s collection efforts, including customer-sponsored payment programs. The decrease in inventories is primarily due to
a combination of: (1) planned inventory reductions driven by corporate initiatives, (2) an increasingly seasonal demand for digital products in
anticipation of the holiday season, and (3) a decline in demand for traditional products. In addition, the Company reported a net loss of $1,362 million,
which, when adjusted for the earnings from discontinued operations, cumulative effect of a change in accounting principle, equity in earnings from
unconsolidated affi liates, depreciation and amortization, purchased research and development, the gain on sales of businesses/assets, restructuring
costs, asset impairments and other non-cash charges, and provision for deferred taxes, provided $582 million of operating cash. These sources of
cash were further increased by the favorable impacts of the Company’s continuing progress in the monetization of its intellectual property.
The net cash used in investing activities of $1,304 million was utilized primarily for capital expenditures of $472 million and business acquisitions of
$984 million. These uses of cash were partially offset by $130 million from the sale of assets and investments. The net cash provided by fi nancing
activities of $533 million was primarily the result of a net increase in borrowings of $722 million due to the funding of the acquisition of Creo during
the second quarter of 2005, partially offset by repayments of debt.
The Company’s primary uses of cash include debt payments, acquisitions, capital additions, restructuring payments, dividend payments, employee
benefi t plan payments/contributions, and working capital needs.
Acquisitions were $984 million in 2005, net of cash acquired. Approximately $927 million and $11 million of this amount is related to the acquisitions
of Creo and KPG, respectively. The acquisition of Creo uniquely positions the Company to be the preferred partner for its customers, helping them
improve effi ciency, expand their offerings and grow their business. The acquisition of KPG further establishes the Company as a leader in the
graphics communications industry and complements the Company’s existing business in this market. Both Creo and KPG operate within the Graphic
Communications Group segment. The remaining amount of $46 million was utilized to complete the acquisition of OREX. The acquisition of OREX
adds the technology of OREX’s small format computed radiography products for use in various health imaging markets.
Capital additions were $472 million in 2005, with the majority of the spending supporting new products, manufacturing productivity and quality
improvements, infrastructure improvements, and ongoing environmental and safety initiatives.
During the year ended December 31, 2005, the Company expended $508 million against the related restructuring reserves, primarily for the payment
of severance benefi ts. Employees whose positions were eliminated could elect to receive their severance payments over a period not to exceed two
years following their date of termination.
As a result of the cumulative impact of the ongoing position eliminations under its Pre-2004 and 2004-2007 Restructuring Programs as disclosed
in Note 16 and above as part of Management’s Discussion and Analysis of Financial Condition and Results of Operations, the Company incurred