Kodak 2005 Annual Report Download - page 73
Download and view the complete annual report
Please find page 73 of the 2005 Kodak annual report below. You can navigate through the pages in the report by either clicking on the pages listed below, or by using the keyword search tool below to find specific information within the annual report.-
 1
1 -
2
-
3
-
4
-
5
-
6
-
7
-
8
-
9
-
10
-
11
-
12
-
13
-
14
-
15
-
16
-
17
-
18
-
19
-
20
-
21
-
22
-
23
-
24
-
25
-
26
-
27
-
28
-
29
-
30
-
31
-
32
-
33
-
34
-
35
-
36
-
37
-
38
-
39
-
40
-
41
-
42
-
43
-
44
-
45
-
46
-
47
-
48
-
49
-
50
-
51
-
52
-
53
-
54
-
55
-
56
-
57
-
58
-
59
-
60
-
61
-
62
-
 63
63 -
 64
64 -
 65
65 -
 66
66 -
 67
67 -
 68
68 -
 69
69 -
 70
70 -
 71
71 -
 72
72 -
 73
73 -
 74
74 -
 75
75 -
 76
76 -
 77
77 -
 78
78 -
 79
79 -
 80
80 -
 81
81 -
 82
82 -
 83
83 -
84
-
85
-
86
-
87
-
88
-
89
-
90
-
91
-
92
-
93
-
94
-
95
-
96
-
97
-
98
-
99
-
100
-
101
-
102
-
103
-
104
-
105
-
106
-
107
-
108
-
109
-
110
-
111
-
112
-
113
-
114
-
115
-
116
-
117
-
118
-
119
-
120
-
121
-
122
-
123
-
124
-
125
-
126
-
127
-
128
-
129
-
130
-
131
-
132
-
133
-
134
-
135
-
136
-
137
-
138
-
139
-
140
-
141
-
142
-
143
-
144
-
145
-
146
-
147
-
148
-
149
-
150
-
151
-
152
-
153
-
154
-
155
-
156
-
157
-
158
-
159
-
160
-
161
-
162
-
163
-
164
-
165
-
166
-
167
-
168
-
169
-
170
-
171
-
172
-
173
-
174
-
175
-
176
-
177
-
178
-
179
-
180
-
181
-
182
-
183
-
184
-
185
-
186
-
187
-
188
-
189
-
190
-
191
-
192
-
193
-
194
-
195
-
196
-
197
-
198
-
199
-
200
-
201
-
202
-
203
-
204
-
205
-
206
-
207
-
208
-
209
-
210
-
211
-
212
-
213
-
214
-
215
-
216
-
217
-
218
-
219
-
220
 |
 |

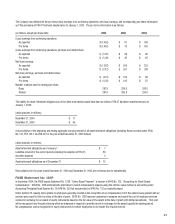
71
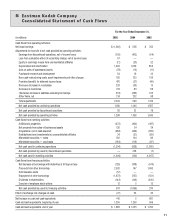
For the Year Ended December 31,
(in millions) 2005 2004 2003
Cash fl ows from operating activities:
Net (loss) earnings $ (1,362) $ 556 $ 253
Adjustments to reconcile to net cash provided by operating activities:
Earnings from discontinued operations, net of income taxes (150) (475) (64)
Loss from cumulative effect of accounting change, net of income taxes 57 — —
Equity in (earnings) losses from unconsolidated affi liates (12) (20) 52
Depreciation and amortization 1,402 1,030 864
Gain on sales of businesses/assets (78) (13) (11)
Purchased research and development 54 16 32
Non-cash restructuring costs, asset impairments and other charges 195 130 156
Provision (benefi t) for deferred income taxes 476 (37) (49)
Decrease (increase) in receivables 228 (43) 15
Decrease in inventories 274 83 118
(Decrease) increase in liabilities excluding borrowings (118) (283) 103
Other items, net 214 202 9 8
Total adjustments 2,542 590 1,314
Net cash provided by continuing operations 1,180 1,146 1,567
Net cash provided by discontinued operations 28 22 78
Net cash provided by operating activities 1,208 1,168 1,645
Cash fl ows from investing activities:
Additions to properties (472) (460) (497)
Net proceeds from sales of businesses/assets 130 24 24
Acquisitions, net of cash acquired (984) (369) (697)
Distributions from (investments in) unconsolidated affi liates 34 (31) (89)
Marketable securities — sales 182 124 86
Marketable securities — purchases (194) (116) (87)
Net cash used in continuing operations (1,304) (828) (1,260)
Net cash provided by (used in) discontinued operations — 708 (7)
Net cash used in investing activities (1,304) (120) (1,267)
Cash fl ows from fi nancing activities:
Net decrease in borrowings with maturities of 90 days or less (126) ( 3 0 8 ) ( 5 7 4 )
Proceeds from other borrowings 2,520 147 1,693
Debt issuance costs (57) — —
Repayment of other borrowings (1,672) (767) (531)
Dividends to shareholders (144) (143) (330)
Exercise of employee stock options 12 5 12
Net cash provided by (used in) fi nancing activities 533 (1,066) 270
Effect of exchange rate changes on cash (27) 23 33
Net increase in cash and cash equivalents 410 5 681
Cash and cash equivalents, beginning of year 1,255 1,250 569
Cash and cash equivalents, end of year $ 1,665 $ 1,255 $ 1,250
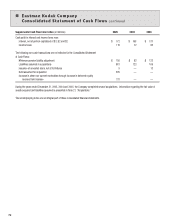
Eastman Kodak Company
Consolidated Statement of Cash Flows