Kodak 2005 Annual Report Download - page 131
Download and view the complete annual report
Please find page 131 of the 2005 Kodak annual report below. You can navigate through the pages in the report by either clicking on the pages listed below, or by using the keyword search tool below to find specific information within the annual report.-
 1
1 -
2
-
3
-
4
-
5
-
6
-
7
-
8
-
9
-
10
-
11
-
12
-
13
-
14
-
15
-
16
-
17
-
18
-
19
-
20
-
21
-
22
-
23
-
24
-
25
-
26
-
27
-
28
-
29
-
30
-
31
-
32
-
33
-
34
-
35
-
36
-
37
-
38
-
39
-
40
-
41
-
42
-
43
-
44
-
45
-
46
-
47
-
48
-
49
-
50
-
51
-
52
-
53
-
54
-
55
-
56
-
57
-
58
-
59
-
60
-
61
-
62
-
63
-
64
-
65
-
66
-
67
-
68
-
69
-
70
-
71
-
72
-
73
-
74
-
75
-
76
-
77
-
78
-
79
-
80
-
81
-
82
-
83
-
84
-
85
-
86
-
87
-
88
-
89
-
90
-
91
-
92
-
93
-
94
-
95
-
96
-
97
-
98
-
99
-
100
-
101
-
102
-
103
-
104
-
105
-
106
-
107
-
108
-
109
-
110
-
111
-
112
-
113
-
114
-
115
-
116
-
117
-
118
-
119
-
120
-
 121
121 -
 122
122 -
 123
123 -
 124
124 -
 125
125 -
 126
126 -
 127
127 -
 128
128 -
 129
129 -
 130
130 -
 131
131 -
 132
132 -
 133
133 -
 134
134 -
 135
135 -
 136
136 -
 137
137 -
 138
138 -
 139
139 -
 140
140 -
 141
141 -
142
-
143
-
144
-
145
-
146
-
147
-
148
-
149
-
150
-
151
-
152
-
153
-
154
-
155
-
156
-
157
-
158
-
159
-
160
-
161
-
162
-
163
-
164
-
165
-
166
-
167
-
168
-
169
-
170
-
171
-
172
-
173
-
174
-
175
-
176
-
177
-
178
-
179
-
180
-
181
-
182
-
183
-
184
-
185
-
186
-
187
-
188
-
189
-
190
-
191
-
192
-
193
-
194
-
195
-
196
-
197
-
198
-
199
-
200
-
201
-
202
-
203
-
204
-
205
-
206
-
207
-
208
-
209
-
210
-
211
-
212
-
213
-
214
-
215
-
216
-
217
-
218
-
219
-
220
 |
 |
129
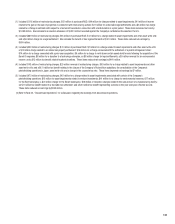
(1) Gross profi t amounts have been adjusted to refl ect reallocation of certain benefi t costs. See Note 23, “Segment Information” for further information.
(2) Includes $206 million ($91 million included in cost of goods sold and $115 million included in restructuring costs and other) of restructuring charges, which
increased net loss by $149 million.
(3) Includes $339 million ($86 million included in cost of goods sold and $253 million included in restructuring costs and other) of restructuring charges, which
reduced net earnings by $240 million; $64 million of purchased R&D, which increased net loss by $39 million; $19 million of strategic asset impairment charges
related to Lucky Film, which increased net loss by $19 million; and a $13 million gain on the sale of properties, which reduced net loss by $11 million.
(4) Includes $278 million ($115 million included in cost of goods sold and $163 million included in restructuring costs and other) of restructuring charges, as well as
the reversal of tax benefi ts recognized earlier in the year resulting from the valuation allowance on deferred tax assets in the U.S. established in the third quarter,
which increased net loss by $363 million; $12 million of credits related to purchased R&D recorded in the second quarter, which reduced net loss by $2 million;
$21 million of asset impairment charges, which increased net loss by $12 million; and a gain of $28 million related to a sale of property in the UK, which reduced
net loss by $28 million.
(5) Includes $295 million ($136 million included in cost of goods sold and $159 million included in restructuring costs and other) of restructuring charges, which
increased net loss by $268 million; $4 million of asset impairment charges, which increased net loss by $4 million; and $21 million (included in SG&A) related to
charges for unfavorable legal settlements, which increased net loss by $21 million.
(6) Includes $78 million ($24 million included in cost of goods sold and $54 million included in restructuring costs and other) of restructuring charges, which reduced
net earnings by $56 million; and $9 million of purchased R&D, which reduced net earnings by $6 million.
(7) Includes $168 million ($34 million included in cost of goods sold and $134 million included in restructuring costs and other) of restructuring charges, which
reduced net earnings by $107 million.
(8) Includes $264 million ($37 million included in cost of goods sold and $227 million included in restructuring costs and other) of restructuring charges, which
reduced net earnings by $202 million; and $6 million of purchased R&D, which reduced net earnings by $4 million.
(9) Includes the gain on the sale of RSS to ITT.
(10) Includes $391 million ($111 million included in cost of goods sold and $280 million included in restructuring costs and other) of restructuring and impairment
charges, which increased net loss by $262 million; and $6 million (included in SG&A) related to a charge for a legal settlement, which increased net loss by
$4 million. Also includes the benefi t of two favorable legal settlements of $101 million (included in other income (charges), net), which reduced net loss by
$63 million.
(11) Refer to Note 22, “Discontinued Operations” for a discussion regarding earnings (loss) from discontinued operations.
(12) Each quarter is calculated as a discrete period and the sum of the four quarters may not equal the full year amount. The Company’s diluted net (loss) earnings
per share in the above table includes the effect of contingent convertible debt instruments, which had no material impact on the Company’s diluted earnings
per share.
(13) Refer to Note 1, “Signifi cant Accounting Policies” for a discussion regarding a change in accounting principle relating to the adoption of FIN 47 during the fourth
quarter of 2005.
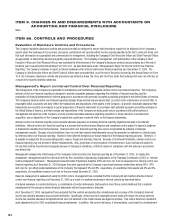
Changes in Estimates Recorded During the Fourth Quarter December 31, 2005
During the fourth quarter ended December 31, 2005, the Company recorded approximately $25 million, net of tax, related to changes in estimate
with respect to certain of its employee benefi t and compensation accruals. These changes in estimates negatively impacted the results for the fourth
quarter by $.09 per share.