IBM 2009 Annual Report Download - page 91
Download and view the complete annual report
Please find page 91 of the 2009 IBM annual report below. You can navigate through the pages in the report by either clicking on the pages listed below, or by using the keyword search tool below to find specific information within the annual report.-
 1
1 -
2
-
3
-
4
-
5
-
6
-
7
-
8
-
9
-
10
-
11
-
12
-
13
-
14
-
15
-
16
-
17
-
18
-
19
-
20
-
21
-
22
-
23
-
24
-
25
-
26
-
27
-
28
-
29
-
30
-
31
-
32
-
33
-
34
-
35
-
36
-
37
-
38
-
39
-
40
-
41
-
42
-
43
-
44
-
45
-
46
-
47
-
48
-
49
-
50
-
51
-
52
-
53
-
54
-
55
-
56
-
57
-
58
-
59
-
60
-
61
-
62
-
63
-
64
-
65
-
66
-
67
-
68
-
69
-
70
-
71
-
72
-
73
-
74
-
75
-
76
-
77
-
78
-
79
-
80
-
 81
81 -
 82
82 -
 83
83 -
 84
84 -
 85
85 -
 86
86 -
 87
87 -
 88
88 -
 89
89 -
 90
90 -
 91
91 -
 92
92 -
 93
93 -
 94
94 -
 95
95 -
 96
96 -
 97
97 -
 98
98 -
 99
99 -
 100
100 -
 101
101 -
102
-
103
-
104
-
105
-
106
-
107
-
108
-
109
-
110
-
111
-
112
-
113
-
114
-
115
-
116
-
117
-
118
-
119
-
120
-
121
-
122
-
123
-
124
-
125
-
126
-
127
-
128
-
129
-
130
-
131
-
132
-
133
-
134
-
135
-
136
 |
 |

Notes to Consolidated Financial Statements
INTERNATIONAL BUSINESS MACHINES CORPORATION AND SUBSIDIARY COMPANIES
financing arrangements are for terms ranging generally from two
to seven years. Each financing contract is priced independently at
competitive market rates. The company has a history of enforcing
the terms of these separate financing agreements.
The company utilizes certain of its financing receivables as
collateral for non-recourse borrowings. Financing receivables
pledged as collateral for borrowings were $271 million and $373
million at December 31, 2009 and 2008, respectively. These bor-
rowings are included in note K, “Borrowings,” on pages 90 to 92.
The company did not have any financing receivables held for
sale as of December 31, 2009 and 2008.
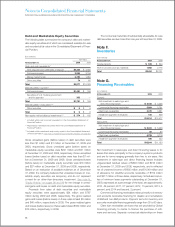
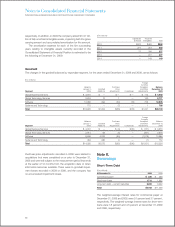
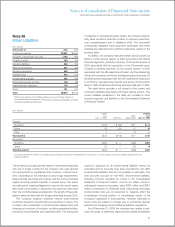
Note H.
Plant, Rental Machines and
Other Property
($ in millions)
At December 31: 2009 2008
Land and land improvements $ 737 $ 729
Buildings and building improvements 9,314 8,819
Plant, laboratory and office equipment 25,888 24,950
35,940 34,499
Less: Accumulated depreciation 23,485 22,178
Plant and other property — net 12,455 12,321
Rental machines 3,656 3,946
Less: Accumulated depreciation 1,946 1,962
Rental machines — net 1,710 1,984
Total— net $14,165 $14,305
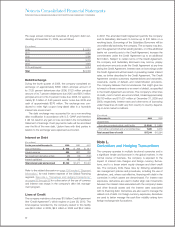
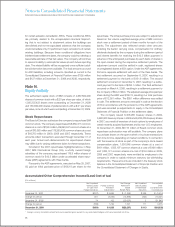
Note I.
Investments and Sundry Assets
($ in millions)
At December 31: 2009 2008*
Deferred transition and setup costs
and other deferred arrangements** $1,772 $1,548
Derivatives — noncurrent
+ 565 1,117
Alliance investments:
Equity method 115 167
Non-equity method 477 285
Prepaid software 312 370
Long-term deposits 310 277
Other receivables 617 238
Employee benefit-related 427 372
Other assets 783 685
Total $5,379 $5,058
* Reclassified to conform with 2009 presentation.
** Deferred transition and setup costs and other deferred arrangements are related
to Global Services client arrangements. Also see note A, “Significant Accounting
Policies,” on pages 70 to 79 for additional information.
+ See note L, “Derivatives and Hedging Transactions,” on pages 92 through 96
for the fair value of all derivatives reported in the Consolidated Statement of
Financial Position.
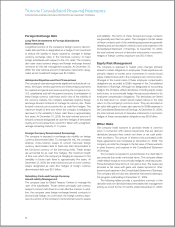
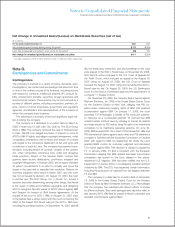
Note J.
Intangible Assets Including Goodwill
Intangible Assets
The following table details the company’s intangible asset bal-
ances by major asset class.
($ in millions)
At December 31, 2009
Gross Net
Carrying Accumulated Carrying
Intangible Asset Class Amount Amortization Amount
Capitalized software $1,765 $ (846) $ 919
Client-related 1,367 (677) 690
Completed technology 1,222 (452) 770
Patents/trademarks 174 (59) 115
Other* 94 (75) 19
Total $4,622 $(2,109) $2,513
* Other intangibles are primarily acquired proprietary and nonproprietary business
processes, methodologies and systems, and impacts from currency translation.
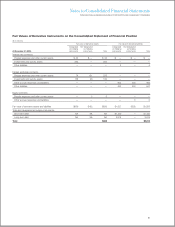
($ in millions)
At December 31, 2008
Gross Net
Carrying Accumulated Carrying
Intangible Asset Class Amount Amortization Amount
Capitalized software $1,861 $ (839) $1,022
Client-related 1,532 (663) 869
Completed technology 1,167 (327) 840
Patents/trademarks 188 (76) 112
Other* 154 (121) 35
Total $4,901 $(2,023) $2,878
* Other intangibles are primarily acquired proprietary and nonproprietary business
processes, methodologies and systems, and impacts from currency translation.
The net carrying amount of intangible assets decreased $365
million for the year ended December 31, 2009, primarily due to
amortization of acquired intangibles. No impairment of intangible
assets was recorded in any of the periods presented.
Total amortization was $1,221 million and $1,310 million for
the years ended December 31, 2009 and 2008, respectively.
The aggregate intangible amortization expense for acquired
intangibles (excluding capitalized software) was $489 million and
$520 million for the years ended December 31, 2009 and 2008,
89