IBM 2009 Annual Report Download - page 51
Download and view the complete annual report
Please find page 51 of the 2009 IBM annual report below. You can navigate through the pages in the report by either clicking on the pages listed below, or by using the keyword search tool below to find specific information within the annual report.-
 1
1 -
2
-
3
-
4
-
5
-
6
-
7
-
8
-
9
-
10
-
11
-
12
-
13
-
14
-
15
-
16
-
17
-
18
-
19
-
20
-
21
-
22
-
23
-
24
-
25
-
26
-
27
-
28
-
29
-
30
-
31
-
32
-
33
-
34
-
35
-
36
-
37
-
38
-
39
-
40
-
 41
41 -
 42
42 -
 43
43 -
 44
44 -
 45
45 -
 46
46 -
 47
47 -
 48
48 -
 49
49 -
 50
50 -
 51
51 -
 52
52 -
 53
53 -
 54
54 -
 55
55 -
 56
56 -
 57
57 -
 58
58 -
 59
59 -
 60
60 -
 61
61 -
62
-
63
-
64
-
65
-
66
-
67
-
68
-
69
-
70
-
71
-
72
-
73
-
74
-
75
-
76
-
77
-
78
-
79
-
80
-
81
-
82
-
83
-
84
-
85
-
86
-
87
-
88
-
89
-
90
-
91
-
92
-
93
-
94
-
95
-
96
-
97
-
98
-
99
-
100
-
101
-
102
-
103
-
104
-
105
-
106
-
107
-
108
-
109
-
110
-
111
-
112
-
113
-
114
-
115
-
116
-
117
-
118
-
119
-
120
-
121
-
122
-
123
-
124
-
125
-
126
-
127
-
128
-
129
-
130
-
131
-
132
-
133
-
134
-
135
-
136
 |
 |

cost, but is both intelligent and secure. The systems product
line will be significantly refreshed in 2010 with the release of the
next generation System z mainframe in the second half and the
next generation POWER systems in System p beginning in the
first quarter of 2010.
In 2010, Global Financing will continue to focus on expand-
ing its core business by accelerating growth in the participation
rates for IBM products and services transactions. In addition,
the business will drive increased operational efficiency and
sales productivity through the deployment of its single operating
model initiative. This global initiative is focused on simplifying
processes, standardizing operations and optimizing business
performance.
The company expects 2010 pre-tax retirement-related plan
cost to be approximately $1.5 billion, an increase of approximately
$100 million compared to 2009. This estimate reflects current
pension plan assumptions and the impacts of recent non-U.S.
pension plan redesign efforts. See note U, “Retirement-Related
Benefits,” on pages 109 through 121 for additional information.
The company expects in the normal course of business that
its effective tax rate in 2010 will be approximately 26.0–26.5
percent. The rate will change year to year based on non-recur-
ring events, such as the settlement of income tax audits and
changes in tax laws, as well as recurring factors including the
geographic mix of income before taxes, the timing and amount
of foreign dividend repatriation, state and local taxes and the
effects of various global income tax strategies.
Effective January 1, 2010, the company will implement sev-
eral new accounting standards that have been issued by
the Financial Accounting Standards Board. These standards
include: amended guidance for revenue recognition for arrange-
ments with multiple deliverables; guidance that revises the scope
of existing software revenue recognition accounting; amend-
ments to the accounting rules for variable interest entities and
transfers of financial assets; and, additional disclosure require-
ments for fair value measurements. The company has evaluated
the new guidance and does not expect a material impact on the
Consolidated Financial Statements. See note B, “Accounting
Changes”, on pages 79 to 82 for additional information.
Liquidity and Capital Resources
The company has consistently generated strong cash flow
from operations, improving results year to year and providing
a source of funds ranging between $14.9 billion and $20.8 bil-
lion per year over the past five years. The company provides
for additional liquidity through several sources: maintaining an
adequate cash balance, access to global funding sources,
a committed global credit facility and other committed and
uncommitted lines of credit worldwide. At December 31, 2009,
the company had total unused lines of credit of $17,314 million.
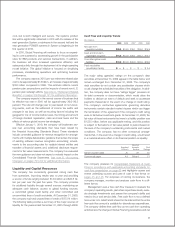
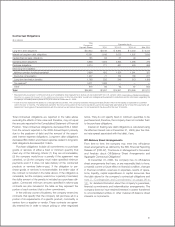
The following table provides a summary of the major sources of
liquidity for the years ended December 31, 2005 through 2009.
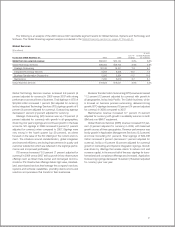
Cash Flow and Liquidity Trends
($ in billions)
2009 2008 2007 2006 2005
Net cash from
operating activities $20.8 $18.8 $16.1 $15.0 $14.9
Cash and short-term
marketable securities $14.0 $12.9 $16.1 $10.7 $13.7
Committed global credit
facilities $10.0 $10.0 $10.0 $10.0 $10.0
Trade receivables
securitization facility $ — $ — $ — $ — $ 0.5
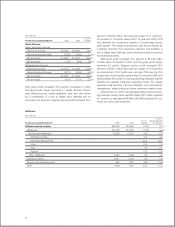
The major rating agencies’ ratings on the company’s debt
securities at December 31, 2009 appear in the table below and
remain unchanged from December 31, 2008. The company’s
debt securities do not contain any acceleration clauses which
could change the scheduled maturities of the obligation. In addi-
tion, the company does not have “ratings trigger” provisions in
its debt covenants or documentation, which would allow the
holders to declare an event of default and seek to accelerate
payments thereunder in the event of a change in credit rating.
The company’s contractual agreements governing derivative
instruments contain standard market clauses which can trigger
the termination of the agreement if the company’s credit rating
were to fall below investment grade. At December 31, 2009, the
fair value of those instruments that were in a liability position was
$1,555 million, before any applicable netting, and this position
is subject to fluctuations in fair value period to period based on
the level of the company’s outstanding instruments and market
conditions. The company has no other contractual arrange-
ments that, in the event of a change in credit rating, would result
in a material adverse effect on its financial position or liquidity.
Moody’s
Standard Investors Fitch
& Poor’s Service Ratings
Senior long-term debt A+ A1 A+
Commercial paper A-1 Prime-1 F1
The company prepares its Consolidated Statement of Cash
Flows in accordance with applicable accounting standards for
cash flow presentation on page 66 and highlights causes and
events underlying sources and uses of cash in that format on
pages 35 and 36. For purposes of running its business, the
company manages, monitors and analyzes cash flows in a dif-
ferent format.
Management uses a free cash flow measure to evaluate the
company’s operating results, plan share repurchase levels, evalu-
ate strategic investments and assess the company’s ability and
need to incur and service debt. Free cash flow is not a defined
term under U.S. GAAP and it should not be inferred that the entire
free cash flow amount is available for discretionary expenditures.
The company defines free cash flow as net cash from operating
activities less the change in Global Financing receivables and net
49