IBM 2009 Annual Report Download - page 132
Download and view the complete annual report
Please find page 132 of the 2009 IBM annual report below. You can navigate through the pages in the report by either clicking on the pages listed below, or by using the keyword search tool below to find specific information within the annual report.-
 1
1 -
2
-
3
-
4
-
5
-
6
-
7
-
8
-
9
-
10
-
11
-
12
-
13
-
14
-
15
-
16
-
17
-
18
-
19
-
20
-
21
-
22
-
23
-
24
-
25
-
26
-
27
-
28
-
29
-
30
-
31
-
32
-
33
-
34
-
35
-
36
-
37
-
38
-
39
-
40
-
41
-
42
-
43
-
44
-
45
-
46
-
47
-
48
-
49
-
50
-
51
-
52
-
53
-
54
-
55
-
56
-
57
-
58
-
59
-
60
-
61
-
62
-
63
-
64
-
65
-
66
-
67
-
68
-
69
-
70
-
71
-
72
-
73
-
74
-
75
-
76
-
77
-
78
-
79
-
80
-
81
-
82
-
83
-
84
-
85
-
86
-
87
-
88
-
89
-
90
-
91
-
92
-
93
-
94
-
95
-
96
-
97
-
98
-
99
-
100
-
101
-
102
-
103
-
104
-
105
-
106
-
107
-
108
-
109
-
110
-
111
-
112
-
113
-
114
-
115
-
116
-
117
-
118
-
119
-
120
-
121
-
 122
122 -
 123
123 -
 124
124 -
 125
125 -
 126
126 -
 127
127 -
 128
128 -
 129
129 -
 130
130 -
 131
131 -
 132
132 -
 133
133 -
 134
134 -
 135
135 -
 136
136
 |
 |

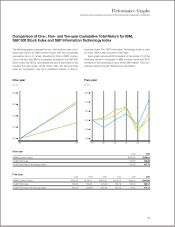
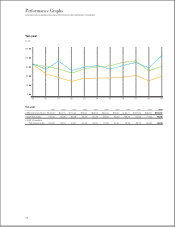
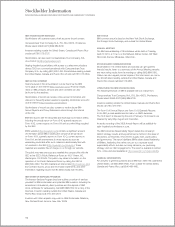
Performance Graphs
INTERNATIONAL BUSINESS MACHINES CORPORATION AND SUBSIDIARY COMPANIES
Ten-year
($ usd)
Ten-year
1999 2000 2001 2002 2003 2004 2005 2006 2007 2008 2009
• IBM Common Stock $100.00 $79.16 $113.20 $73.04 $88.02 $94.34 $79.41 $ 95.11 $107.32 $85.03 $134.87
• S & P 500 Index 100.00 90.89 80.09 62.39 80.29 89.02 93.40 108.15 114.09 71.88 90.90
• S & P Information
Technology Index 100.00 59.10 43.81 27.42 40.37 41.40 41.81 45.33 52.72 29.98 48.48
08
180
160
140
120
100
09 04 05 06 07 08
160
140
120
100
80
60
09
99 00 01 02 03
150
120
90
60
30
0
04 05 06 07 08 09
130