IBM 2009 Annual Report Download - page 69
Download and view the complete annual report
Please find page 69 of the 2009 IBM annual report below. You can navigate through the pages in the report by either clicking on the pages listed below, or by using the keyword search tool below to find specific information within the annual report.-
 1
1 -
2
-
3
-
4
-
5
-
6
-
7
-
8
-
9
-
10
-
11
-
12
-
13
-
14
-
15
-
16
-
17
-
18
-
19
-
20
-
21
-
22
-
23
-
24
-
25
-
26
-
27
-
28
-
29
-
30
-
31
-
32
-
33
-
34
-
35
-
36
-
37
-
38
-
39
-
40
-
41
-
42
-
43
-
44
-
45
-
46
-
47
-
48
-
49
-
50
-
51
-
52
-
53
-
54
-
55
-
56
-
57
-
58
-
 59
59 -
 60
60 -
 61
61 -
 62
62 -
 63
63 -
 64
64 -
 65
65 -
 66
66 -
 67
67 -
 68
68 -
 69
69 -
 70
70 -
 71
71 -
 72
72 -
 73
73 -
 74
74 -
 75
75 -
 76
76 -
 77
77 -
 78
78 -
 79
79 -
80
-
81
-
82
-
83
-
84
-
85
-
86
-
87
-
88
-
89
-
90
-
91
-
92
-
93
-
94
-
95
-
96
-
97
-
98
-
99
-
100
-
101
-
102
-
103
-
104
-
105
-
106
-
107
-
108
-
109
-
110
-
111
-
112
-
113
-
114
-
115
-
116
-
117
-
118
-
119
-
120
-
121
-
122
-
123
-
124
-
125
-
126
-
127
-
128
-
129
-
130
-
131
-
132
-
133
-
134
-
135
-
136
 |
 |

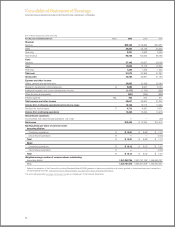
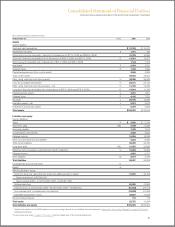
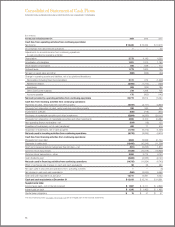
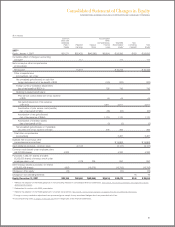
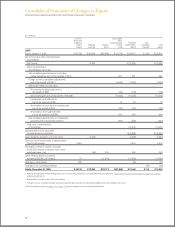
Consolidated Statement of Changes in Equity
INTERNATIONAL BUSINESS MACHINES CORPORATION AND SUBSIDIARY COMPANIES
($ in millions)
Common Accumulated
Stock and Other
Additional Comprehensive Total IBM Non-
Paid-in Retained Treasury Income/ Stockholders’ controlling Total
Capital Earnings Stock (Loss) Equity* Interests* Equity*
2007**
Equity, January 1, 2007 $31,271 $52,432 $(46,296) $(8,901) $ 28,506 $129 $ 28,635
Cumulative effect of change in accounting
principle+ 117 117 117
Net income plus other comprehensive
income/(loss):
Net income 10,418 $ 10,418 $ 10,418
Other comprehensive
income/(loss), net of tax:
Net unrealized gains/(losses) on cash flow
hedge derivatives (net of tax benefit of $32) (123) (123) (123)
Foreign currency translation adjustments
(net of tax benefit of $553++) 726 726 726
Retirement-related benefit plans:
Prior service costs/(credits) (net of tax expense
of $31) 44 44 44
Net gains/(losses) (net of tax expense
of $1,913) 3,611 3,611 3,611
Amortization of prior service costs/(credits)
(net of tax benefit of $50) (85) (85) (85)
Amortization of net gains/(losses)
(net of tax expense of $654) 1,110 1,110 1,110
Amortization of transition assets
(net of tax benefit of $1) (2) (2) (2)
Net unrealized gains/(losses) on marketable
securities (net of tax expense of $132) 206 206 206
Total other comprehensive
income/(loss) 5,487 5,487
Subtotal: Net income plus other
comprehensive income/(loss) $ 15,905 $ 15,905
Cash dividends declared—common stock (2,147) (2,147) (2,147)
Common stock issued under employee plans
(49,137,038 shares) 4,332 4,332 4,332
Purchases (1,282,131 shares) and sales
(9,282,055 shares) of treasury stock under
employee plans — net (179) 729 550 550
Other treasury shares purchased, not retired
(178,385,436 shares) (405) (18,378) (18,783) (18,783)
Changes in other equity (10) (10) (10)
Changes in noncontrolling interests 16 16
Equity, December 31, 2007 $35,188 $60,640 $(63,945) $(3,414) $ 28,470 $145 $ 28,615
* Reflects the adoption of the FASB guidance on noncontrolling interests in consolidated financial statements. See note B, “Accounting Changes,” on pages 79 to 82 for
additional information.
** Reclassified to conform with 2009 presentation.
+ Reflects the adoption of the FASB guidance for uncertain tax positions. See note B, “Accounting Changes,” on pages 79 to 82 for additional information.
++Foreign currency translation adjustments are presented gross except for any associated hedges which are presented net of tax.
The accompanying notes on pages 70 through 126 are an integral part of the financial statements.
67