IBM 2009 Annual Report Download - page 21
Download and view the complete annual report
Please find page 21 of the 2009 IBM annual report below. You can navigate through the pages in the report by either clicking on the pages listed below, or by using the keyword search tool below to find specific information within the annual report.-
 1
1 -
2
-
3
-
4
-
5
-
6
-
7
-
8
-
9
-
10
-
 11
11 -
 12
12 -
 13
13 -
 14
14 -
 15
15 -
 16
16 -
 17
17 -
 18
18 -
 19
19 -
 20
20 -
 21
21 -
 22
22 -
 23
23 -
 24
24 -
 25
25 -
 26
26 -
 27
27 -
 28
28 -
 29
29 -
 30
30 -
 31
31 -
32
-
33
-
34
-
35
-
36
-
37
-
38
-
39
-
40
-
41
-
42
-
43
-
44
-
45
-
46
-
47
-
48
-
49
-
50
-
51
-
52
-
53
-
54
-
55
-
56
-
57
-
58
-
59
-
60
-
61
-
62
-
63
-
64
-
65
-
66
-
67
-
68
-
69
-
70
-
71
-
72
-
73
-
74
-
75
-
76
-
77
-
78
-
79
-
80
-
81
-
82
-
83
-
84
-
85
-
86
-
87
-
88
-
89
-
90
-
91
-
92
-
93
-
94
-
95
-
96
-
97
-
98
-
99
-
100
-
101
-
102
-
103
-
104
-
105
-
106
-
107
-
108
-
109
-
110
-
111
-
112
-
113
-
114
-
115
-
116
-
117
-
118
-
119
-
120
-
121
-
122
-
123
-
124
-
125
-
126
-
127
-
128
-
129
-
130
-
131
-
132
-
133
-
134
-
135
-
136
 |
 |

Management Discussion Snapshot
($ and shares in millions except per share amounts)
Yr.-to-Yr.
Percent/
Margin
For the year ended December 31: 2009 2008 Change
Revenue $ 95,758 $103,630 (7.6)%*
Gross profit margin 45.7% 44.1% 1.7 pts.
Total expense and other income $ 25,647 $ 28,945 (11.4)%
Total expense and other
income-to-revenue ratio 26.8% 27.9% (1.1) pts.
Income before income taxes $ 18,138 $ 16,715 8.5%
Provision for income taxes 4,713 4,381 7.6%
Net income $ 13,425 $ 12,334 8.8%
Net income margin 14.0% 11.9% 2.1 pts.
Earnings per share of
common stock:
Assuming dilution $ 10.01 $ 8.89+ 12.6%
Weighted-average shares
outstanding:
Assuming dilution 1,341.4 1,387.8+ (3.3)%
Assets** $109,022 $109,524 (0.5)%
Liabilities** $ 86,267 $ 95,939++ (10.1)%
Equity** $ 22,755 $ 13,584++ 67.5%
* (5.3) percent adjusted for currency.
** At December 31.
+ Reflects the adoption of the Financial Accounting Standards Board (FASB)
guidance in determining whether instruments granted in share-based payment
transactions are participating securities. See note B, “Accounting Changes,”
on pages 79 to 82 for additional information.
++ Reflects the adoption of the FASB guidance on noncontrolling interests in
consolidated financial statements. See note B, “Accounting Changes,” on
pages 79 to 82 for additional information.
In 2009, in a difficult global economic environment, the com-
pany continued to deliver value to its clients and strong financial
results to its investors—with profit growth driven by continued
margin expansion, expense productivity, market share gains in
software and systems and a continuing strong cash position.
The company again achieved record levels of pre-tax profit,
earnings per share and cash flow from operations—despite
a decline in revenue. The financial performance reflected the
strength of the company’s global model and the results of the
strategic transformation of the business.
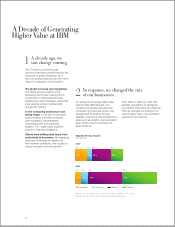
The company’s transformation, which started at the begin-
ning of the decade, is driven by a combination of shifting the
business mix, improving operating leverage through productivity
and investing to capture growth opportunities.
The company has exited commoditizing businesses and
remixed its portfolio to higher value areas through organic invest-
ments and acquisitions. This shift to higher value areas drives a
more profitable mix and enables the company to better meet
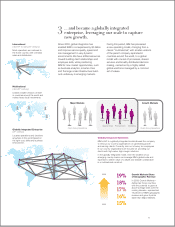
clients’ needs. In addition, the focus on global integration has
improved productivity and efficiency. The company’s ongoing
initiatives have reduced the fixed cost base and improved the
operational balance point—generating more profit for each dol-
lar of revenue. The strong profit and cash base has enabled the
company to make significant investments for growth and return
capital to shareholders. Key areas of investment include Smarter
Planet solutions, business analytics, growth market opportuni-
ties and new computing models such as cloud computing.
The strategic transformation of the company has enabled the
company to deliver strong financial performance since the last
recession in 2002, including the difficult environment in 2008
and 2009, and has positioned the business for the future.
For the year, the company delivered $10.01 in diluted earn-
ings per share, an increase of 12.6 percent year to year. This
was the seventh consecutive year of double-digit earnings per
share growth. In 2007, the company developed a road map for
growth with an earnings per share objective for 2010 of $10
to $11 per share. With its performance in 2009, the company
achieved this objective one year early.
Total revenue decreased 7.6 percent (5 percent adjusted for
currency) compared to 2008. Revenue from the growth markets
declined 3.5 percent, but increased 1 percent at constant cur-
rency. Performance was led by the BRIC countries of Brazil,
Russia, India and China which increased 4 percent, adjusted for
currency. Segment performance was driven by Software which
decreased 3.1 percent year to year (1 percent adjusted for
currency) and Global Technology Services which declined 4.9
percent (2 percent adjusted for currency). Within Software per-
formance was led by key branded middleware which increased
revenue 1.1 percent (3 percent adjusted for currency) compared
to the prior year.
Gross profit margins improved reflecting the shift to higher
value businesses and the continued focus on productivity
and cost management. The consolidated gross profit margin
increased 1.7 points versus 2008 to 45.7 percent. This was the
sixth consecutive year of improvement in the gross profit margin.
Gross profit margin performance by segment and the impact to
the consolidated gross margin was as follows:
Gross Yr.-to-Yr. Consolidated
Margin Change Impact
Global Technology Services 35.0% 2.4 pts. 0.8 pts.
Global Business Services 28.2% 1.5 pts. 0.4 pts.
Software 86.0% 0.6 pts. 0.6 pts.
Systems & Technology 37.8% (0.2) pts. 0.1 pts.
Global Financing 47.5% (3.8) pts. (0.1) pts.
Total expense and other income decreased 11.4 percent in 2009
versus 2008. The year-to-year drivers were approximately:
• Operational expense, (9) points
• Currency, (4) points
• Acquisitions, 1 point
19