IBM 2009 Annual Report Download - page 48
Download and view the complete annual report
Please find page 48 of the 2009 IBM annual report below. You can navigate through the pages in the report by either clicking on the pages listed below, or by using the keyword search tool below to find specific information within the annual report.-
 1
1 -
2
-
3
-
4
-
5
-
6
-
7
-
8
-
9
-
10
-
11
-
12
-
13
-
14
-
15
-
16
-
17
-
18
-
19
-
20
-
21
-
22
-
23
-
24
-
25
-
26
-
27
-
28
-
29
-
30
-
31
-
32
-
33
-
34
-
35
-
36
-
37
-
 38
38 -
 39
39 -
 40
40 -
 41
41 -
 42
42 -
 43
43 -
 44
44 -
 45
45 -
 46
46 -
 47
47 -
 48
48 -
 49
49 -
 50
50 -
 51
51 -
 52
52 -
 53
53 -
 54
54 -
 55
55 -
 56
56 -
 57
57 -
 58
58 -
59
-
60
-
61
-
62
-
63
-
64
-
65
-
66
-
67
-
68
-
69
-
70
-
71
-
72
-
73
-
74
-
75
-
76
-
77
-
78
-
79
-
80
-
81
-
82
-
83
-
84
-
85
-
86
-
87
-
88
-
89
-
90
-
91
-
92
-
93
-
94
-
95
-
96
-
97
-
98
-
99
-
100
-
101
-
102
-
103
-
104
-
105
-
106
-
107
-
108
-
109
-
110
-
111
-
112
-
113
-
114
-
115
-
116
-
117
-
118
-
119
-
120
-
121
-
122
-
123
-
124
-
125
-
126
-
127
-
128
-
129
-
130
-
131
-
132
-
133
-
134
-
135
-
136
 |
 |

markets, together grew 17.6 percent (15 percent adjusted for
currency), with growth in India of 25.8 percent (33 percent
adjusted for currency), Brazil 18.3 percent (13 percent adjusted
for currency), China 14.7 percent (8 percent adjusted for cur-
rency) and Russia 11.0 percent (11 percent adjusted for currency).
OEM revenue decreased 22.4 percent (23 percent adjusted
for currency) in 2008 when compared to 2007, driven by
reduced demand in the Microelectronics OEM business.
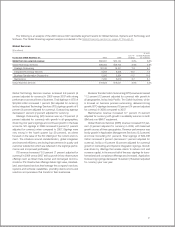
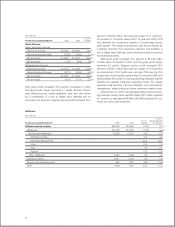
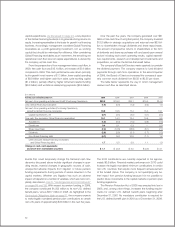
Total Expense and Other Income
($ in millions)
Yr.-to-Yr.
For the year ended December 31: 2008 2007 Change
Total expense and other income $28,945 $27,240 6.3%
Expense to Revenue 27.9% 27.6% 0.4 pts.
The key drivers year to year in total expense and other income
were approximately:
• Operational expense, (1) point
• Acquisitions, 5 points
• Currency, 2 points
In 2008, the company continued to focus on productivity
improvements in its more established markets and increased
its investments in the growth markets. Within selling, general
and administrative expense (SG&A), total sales and marketing
expense increased 4 percent year to year (2 percent adjusted
for currency). Sales and marketing expense in the growth mar-
kets increased 13 percent (13 percent adjusted for currency),
as compared to major markets where sales and marketing
expense increased 3 percent (1 percent adjusted for currency)
year to year. On a consolidated basis, general and administrative
expenses, which are indirect expenses incurred in the business,
increased 2 percent (flat at constant currency) year to year.
Total SG&A expense increased 6.0 percent (4 percent
adjusted for currency) in 2008 versus 2007. The increase in SG&A
was primarily due to acquisition-related spending, predominantly
for Cognos and Telelogic, which accounted for 5 points of the
increase, while the effects of currency accounted for 2 points.
Workforce reductions—ongoing expense increased $387 million
primarily due to charges recorded in the fourth quarter reflect-
ing workforce actions in Japan ($120 million) and other ongoing
skills rebalancing that is a regular element of the company’s
business model. In addition, bad debt expense increased $206
million primarily driven by additional specific accounts receivable
reserves reflecting the current economic environment in many
industries. The company’s accounts receivable provision cover-
age at December 31, 2008 was 2.0 percent, an increase of 50
basis points from year-end 2007. These increases were partially
offset by lower retirement-related expense of $287 million.
Other (income) and expense was income of $298 million
and $626 million in 2008 and 2007, respectively. The decrease
in income was primarily driven by higher foreign currency trans-
action losses ($285 million) and lower interest income reflecting
lower cash balances and the current interest rate environment
($222 million). These decreases were partially offset by a gain
on derivative instruments which primarily hedge foreign currency
risks ($221 million). Included within the foreign currency hedging
activity, the company hedges its major cross-border cash flows
to mitigate the effect of currency volatility in its global cash plan-
ning, which also reduces volatility in the year-over-year results.
The impact of these hedging programs is primarily reflected in
other (income) and expense, as well as cost of goods sold. The
impact of losses from these cash flow hedges reflected in other
(income) and expense was $186 million, a decrease of $24 mil-
lion year to year.
The increase in RD&E expense of $184 million was primarily
driven by acquisitions and investments to maintain technology
leadership across the company’s offerings. Software spending
increased $262 million, partially offset by lower spending in
Systems and Technology ($54 million) and other unit spending
($74 million).
IP income of $1,153 million increased 20.4 percent in 2008,
however, there were no significant individual IP transactions
in 2008 or 2007. The improvement year to year was primarily
driven by the Systems and Technology business.
The increase in interest expense of $63 million to $673
million was primarily due to the increase in debt in 2007 asso-
ciated with the financing of the accelerated share repurchase
agreements, partially offset by lower interest rates in 2008. See
note N, “Equity Activity,” on page 98 for additional information
regarding the accelerated share repurchase. Overall interest
expense, including amounts reflected in cost of financing, for
2008 was $1,462 million, an increase of $40 million versus 2007.
46