IBM 2009 Annual Report Download - page 125
Download and view the complete annual report
Please find page 125 of the 2009 IBM annual report below. You can navigate through the pages in the report by either clicking on the pages listed below, or by using the keyword search tool below to find specific information within the annual report.-
 1
1 -
2
-
3
-
4
-
5
-
6
-
7
-
8
-
9
-
10
-
11
-
12
-
13
-
14
-
15
-
16
-
17
-
18
-
19
-
20
-
21
-
22
-
23
-
24
-
25
-
26
-
27
-
28
-
29
-
30
-
31
-
32
-
33
-
34
-
35
-
36
-
37
-
38
-
39
-
40
-
41
-
42
-
43
-
44
-
45
-
46
-
47
-
48
-
49
-
50
-
51
-
52
-
53
-
54
-
55
-
56
-
57
-
58
-
59
-
60
-
61
-
62
-
63
-
64
-
65
-
66
-
67
-
68
-
69
-
70
-
71
-
72
-
73
-
74
-
75
-
76
-
77
-
78
-
79
-
80
-
81
-
82
-
83
-
84
-
85
-
86
-
87
-
88
-
89
-
90
-
91
-
92
-
93
-
94
-
95
-
96
-
97
-
98
-
99
-
100
-
101
-
102
-
103
-
104
-
105
-
106
-
107
-
108
-
109
-
110
-
111
-
112
-
113
-
114
-
 115
115 -
 116
116 -
 117
117 -
 118
118 -
 119
119 -
 120
120 -
 121
121 -
 122
122 -
 123
123 -
 124
124 -
 125
125 -
 126
126 -
 127
127 -
 128
128 -
 129
129 -
 130
130 -
 131
131 -
 132
132 -
 133
133 -
 134
134 -
 135
135 -
136
 |
 |

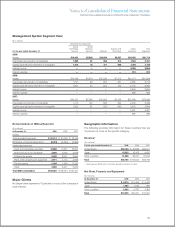
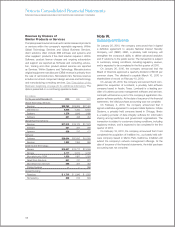
Notes to Consolidated Financial Statements
INTERNATIONAL BUSINESS MACHINES CORPORATION AND SUBSIDIARY COMPANIES
Management System Segment View
($ in millions)
Global Services Segments
Global Global
Technology Business Systems and Global Total
For the year ended December 31: Services Services Software Technology Financing Segments
2009:
External revenue $37,347 $17,653 $21,396 $ 16,190 $2,302 $ 94,889
Internal revenue 1,386 887 2,677 911 1,774 7,635
Total revenue $38,734 $18,540 $24,073 $17,102 $4,076 $102,524
Pre-tax income $ 5,537 $ 2,555 $ 8,095 $ 1,419 $1,730 $ 19,335
Revenue year-to-year change (5.1)% (10.3)% (3.1)% (15.2)% (8.4)% (7.6)%
Pre-tax income year-to-year change 20.2% (4.7)% 14.4% (8.5)% 7.0% 10.3%
Pre-tax income margin 14.3% 13.8% 33.6% 8.3% 42.4% 18.9%
2008:
External revenue $39,264 $19,628 $22,089 $ 19,287 $2,559 $102,827
Internal revenue 1,546 1,044 2,761 882 1,892 8,125
Total revenue $40,810 $20,671 $24,850 $20,169 $4,451 $110,951
Pre-tax income $ 4,607 $ 2,681 $ 7,075 $ 1,550 $1,617 $ 17,531
Revenue year-to-year change 8.1% 7.5% 10.9% (9.6)% 11.7% 5.0%
Pre-tax income year-to-year change 29.5% 29.9% 17.9% (28.0)% 16.7% 15.6%
Pre-tax income margin 11.3% 13.0% 28.5% 7.7% 36.3% 15.8%
2007:
External revenue $36,103 $18,041 $19,982 $21,317 $2,502 $ 97,944
Internal revenue 1,636 1,193 2,416 998 1,482 7,726
Total revenue $37,739 $19,234 $22,398 $22,315 $3,984 $105,670
Pre-tax income $ 3,557 $ 2,064 $ 6,002 $ 2,153 $1,386 $ 15,163
Revenue year-to-year change 10.7% 10.9% 9.7% (3.6)% 2.4% 6.9%
Pre-tax income year-to-year change 8.2% 21.0% 9.3% 23.8% (4.7)% 10.8%
Pre-tax income margin 9.4% 10.7% 26.8% 9.6% 34.8% 14.3%
123