IBM 2009 Annual Report Download - page 47
Download and view the complete annual report
Please find page 47 of the 2009 IBM annual report below. You can navigate through the pages in the report by either clicking on the pages listed below, or by using the keyword search tool below to find specific information within the annual report.-
 1
1 -
2
-
3
-
4
-
5
-
6
-
7
-
8
-
9
-
10
-
11
-
12
-
13
-
14
-
15
-
16
-
17
-
18
-
19
-
20
-
21
-
22
-
23
-
24
-
25
-
26
-
27
-
28
-
29
-
30
-
31
-
32
-
33
-
34
-
35
-
36
-
 37
37 -
 38
38 -
 39
39 -
 40
40 -
 41
41 -
 42
42 -
 43
43 -
 44
44 -
 45
45 -
 46
46 -
 47
47 -
 48
48 -
 49
49 -
 50
50 -
 51
51 -
 52
52 -
 53
53 -
 54
54 -
 55
55 -
 56
56 -
 57
57 -
58
-
59
-
60
-
61
-
62
-
63
-
64
-
65
-
66
-
67
-
68
-
69
-
70
-
71
-
72
-
73
-
74
-
75
-
76
-
77
-
78
-
79
-
80
-
81
-
82
-
83
-
84
-
85
-
86
-
87
-
88
-
89
-
90
-
91
-
92
-
93
-
94
-
95
-
96
-
97
-
98
-
99
-
100
-
101
-
102
-
103
-
104
-
105
-
106
-
107
-
108
-
109
-
110
-
111
-
112
-
113
-
114
-
115
-
116
-
117
-
118
-
119
-
120
-
121
-
122
-
123
-
124
-
125
-
126
-
127
-
128
-
129
-
130
-
131
-
132
-
133
-
134
-
135
-
136
 |
 |

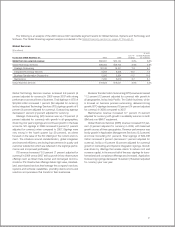
Retail Stores Solutions revenue decreased 15.0 percent (16
percent adjusted for currency) in 2008 versus 2007, reflecting
weakness in the retail sector and a compare to a strong 2007,
when a new programmable point-of-sale solution was being
delivered to large clients.
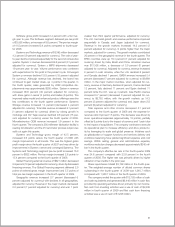
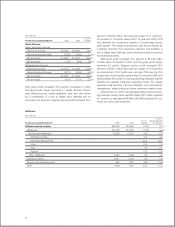
($ in millions)
Yr.-to-Yr.
For the year ended December 31: 2008 2007 Change
Systems and Technology:
External gross profit $7,341 $8,468 (13.3)%
External gross profit margin 38.1% 39.7% (1.7) pts.
Pre-tax income $1,550 $2,153 (28.0)%
Pre-tax margin 7.7% 9.6% (2.0) pts.
Gross margin decreased by 1.7 points versus the prior year. This
decrease was primarily driven by margin declines in System z,
System x and Microelectronics OEM which impacted the overall
margin by 1.6 points, 1.3 points and 1.2 points, respectively.
Partially offsetting these margin declines was a revenue mix
benefit of 2.7 points due to the increased revenue in System z
and converged System p.
Systems and Technology segment pre-tax margin declined
2.0 points to 7.7 percent in 2008 reflecting the lower revenue
and gross profit margin in 2008 versus 2007.
Global Financing
See page 57 for an analysis of Global Financing’s segment results.
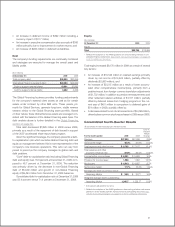
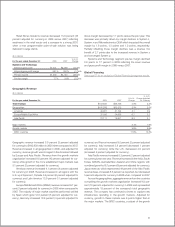
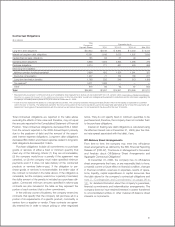
Geographic Revenue
($ in millions)
Yr.-to-Yr.
Yr.-to-Yr. Change Adjusted
For the year ended December 31: 2008 2007 Change for Currency
Total revenue: $103,630 $98,786 4.9% 2.3%
Geographies: $100,939 $95,320 5.9% 3.3%
Americas 42,807 41,122 4.1 3.9
Europe/Middle East/Africa 37,020 34,699 6.7 3.2
Asia Pacific 21,111 19,501 8.3 2.1
Major markets 5.1% 1.9%
Growth markets 9.8% 9.9%
BRIC countries 17.6% 14.5%
Geographic revenue increased 5.9 percent (3 percent adjusted
for currency) to $100,939 million in 2008 when compared to 2007.
Revenue increased in all geographies in 2008, and adjusted for
currency, revenue growth was strongest in the Americas followed
by Europe and Asia Pacific. Revenue from the growth markets
organization increased 9.8 percent (10 percent adjusted for cur-
rency) while growth in the more established major markets was
5.1 percent (2 percent adjusted for currency).
Americas revenue increased 4.1 percent (4 percent adjusted
for currency) in 2008. Revenue increased in all regions with the
U.S. up 2.9 percent, Canada 5.6 percent (6 percent adjusted for
currency) and Latin America 13.9 percent (11 percent adjusted
for currency).
Europe/Middle East/Africa (EMEA) revenue increased 6.7 per-
cent (3 percent adjusted for currency) in 2008 when compared to
2007. The majority of major market countries performed well led
by Spain which grew 12.0 percent (5 percent adjusted for cur-
rency), Germany increased 10.8 percent (4 percent adjusted for
currency) and France increased 9.0 percent (2 percent adjusted
for currency). Italy increased 5.8 percent (decreased 1 percent
adjusted for currency) while the U.K. decreased 4.9 percent
(increased 4 percent adjusted for currency).
Asia Pacific revenue increased 8.3 percent (2 percent adjusted
for currency) year over year. Revenue increased in the India, South
Korea, ASEAN, Australia/New Zealand and China regions with
combined growth of 8.1 percent (9 percent adjusted for currency).
Japan revenue, which represented 49 percent of the Asia Pacific
revenue base, increased 8.5 percent as reported, but decreased
5 percent adjusted for currency in 2008 when compared to 2007.
Across the geographies, aggregate revenue from the countries
comprising the growth markets organization increased 9.8 per-
cent (10 percent adjusted for currency) in 2008 and represented
approximately 18 percent of the company’s total geographic
revenue. The company has continued to invest to capture new
infrastructure spending in the growth markets. Adjusted for
currency, growth in these markets was 8 points higher than in
the major markets. The BRIC countries, a subset of the growth
45