IBM 2009 Annual Report Download - page 22
Download and view the complete annual report
Please find page 22 of the 2009 IBM annual report below. You can navigate through the pages in the report by either clicking on the pages listed below, or by using the keyword search tool below to find specific information within the annual report.-
 1
1 -
2
-
3
-
4
-
5
-
6
-
7
-
8
-
9
-
10
-
11
-
 12
12 -
 13
13 -
 14
14 -
 15
15 -
 16
16 -
 17
17 -
 18
18 -
 19
19 -
 20
20 -
 21
21 -
 22
22 -
 23
23 -
 24
24 -
 25
25 -
 26
26 -
 27
27 -
 28
28 -
 29
29 -
 30
30 -
 31
31 -
 32
32 -
33
-
34
-
35
-
36
-
37
-
38
-
39
-
40
-
41
-
42
-
43
-
44
-
45
-
46
-
47
-
48
-
49
-
50
-
51
-
52
-
53
-
54
-
55
-
56
-
57
-
58
-
59
-
60
-
61
-
62
-
63
-
64
-
65
-
66
-
67
-
68
-
69
-
70
-
71
-
72
-
73
-
74
-
75
-
76
-
77
-
78
-
79
-
80
-
81
-
82
-
83
-
84
-
85
-
86
-
87
-
88
-
89
-
90
-
91
-
92
-
93
-
94
-
95
-
96
-
97
-
98
-
99
-
100
-
101
-
102
-
103
-
104
-
105
-
106
-
107
-
108
-
109
-
110
-
111
-
112
-
113
-
114
-
115
-
116
-
117
-
118
-
119
-
120
-
121
-
122
-
123
-
124
-
125
-
126
-
127
-
128
-
129
-
130
-
131
-
132
-
133
-
134
-
135
-
136
 |
 |

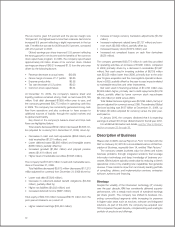
Pre-tax income grew 8.5 percent and the pre-tax margin was
18.9 percent, the highest level in more than a decade. Net income
increased 8.8 percent reflecting a slight improvement in the tax
rate. The effective tax rate for 2009 was 26.0 percent, compared
with 26.2 percent in 2008.
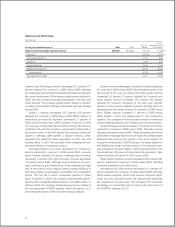
Diluted earnings per share improved 12.6 percent reflecting
the strong growth in net income and the benefits of the common
stock repurchase program. In 2009, the company repurchased
approximately 69 million shares of its common stock. Diluted
earnings per share of $10.01 increased $1.12 from the prior year
driven by the following factors:
• Revenue decrease at actual rates: $(0.68)
• Gross margin increase of 1.7 points: $0.85
• Expense productivity: $0.58
• Tax rate decrease of 0.2 points: $0.03
• Common stock repurchases: $0.34
At December 31, 2009, the company’s balance sheet and
liquidity positions remained strong. Cash on hand was $12,183
million. Total debt decreased $7,826 million year to year, and
the company generated $20,773 million in operating cash flow
in 2009. The company has consistently generated strong cash
flow from operations and also continues to have access to
additional sources of liquidity through the capital markets and
its global credit facility.
Key drivers in the company’s balance sheet and total cash
flows are highlighted below.
Total assets decreased $502 million (decreased $3,885 mil-
lion adjusted for currency) from December 31, 2008, driven by:
• Decreases in cash and cash equivalents ($558 million) and
total receivables ($1,301 million); and
• Lower deferred taxes ($2,888 million) and intangible assets
($365 million), partially offset by;
• Increased goodwill ($1,964 million) and prepaid pension
assets ($1,401 million); and
• Higher level of marketable securities ($1,625 million).
The company had $13,973 million in cash and marketable secu-
rities at December 31, 2009.
Total liabilities decreased $9,672 million (decreased $11,213
million adjusted for currency) from December 31, 2008 driven by:
• Lower total debt ($7,826 million);
• Decrease in retirement-related benefit obligations ($3,500
million), partially offset by;
• Higher tax liabilities ($1,083 million); and
• Increased deferred income ($997 million).
Total equity of $22,755 million increased $9,170 million from the
prior year-end balance as a result of:
• Higher retained earnings ($10,546 million);
• Increase in foreign currency translation adjustments ($1,732
million);
• Increase in retirement-related items ($1,727 million) and com-
mon stock ($2,682 million), partially offset by;
• Increased treasury stock ($7,072 million); and
• Increased net unrealized losses on cash flow derivatives
($556 million).
The company generated $20,773 million in cash flow provided
by operating activities, an increase of $1,961 million, compared
to 2008, primarily driven by a decrease in receivables ($1,857
million). Net cash used in investing activities of $6,729 million
was $2,556 million lower than 2008, primarily due to the prior
year Cognos acquisition and the core logistics operations dives-
titure in 2009, partially offset by the year-to-year impacts related
to marketable securities and other investments.
Net cash used in financing activities of $14,700 million was
$2,866 million higher, primarily due to debt repayments ($5,019
million), partially offset by lower common stock repurchases
($3,150 million) in 2009 versus 2008.
Total Global Services signings were $57,094 million, flat (up 2
percent adjusted for currency) versus 2008. The estimated Global
Services backlog was $137 billion at December 31, 2009, up
$7 billion ($1 billion adjusted for currency) versus the prior year-
end balance.
In January 2010, the company disclosed that it is expecting
earnings of at least $11.00 per diluted share for the full year 2010.
For additional information and details, see the “Year in Review”
section on pages 25 through 39.
Description of Business
Please refer to IBM’s Annual Report on Form 10-K filed with the
SEC on February 23, 2010 for a more detailed version of this Des-
cription of Business, especially Item 1A. entitled “Risk Factors.”
The company creates business value for clients and solves
business problems through integrated solutions that leverage
information technology and deep knowledge of business pro-
cesses. IBM solutions typically create value by reducing a client’s
operational costs or by enabling new capabilities that generate
revenue. These solutions draw from an industry leading portfolio
of consulting, delivery and implementation services, enterprise
software, systems and financing.
Strategy
Despite the volatility of the information technology (IT) industry
over the past decade, IBM has consistently delivered superior
performance, with a steady track record of sustained earnings
per share growth. The company has shifted its business mix,
exiting commoditized segments while increasing its presence
in higher-value areas such as services, software and integrated
solutions. As part of this shift, the company has acquired over
100 companies this past decade, complementing and scaling its
portfolio of products and offerings.
20